Welcome to TCSER
Tumor Cellular Senescence Estimation Resource (TCSER) is a comprehensive resource for systematical quantification of cellular senescence across cancer types. TCSER provides senescence quantification and identification of senescence-associated characteristics, and allow users to explore senescence across TCGA cancer types, immunotherapy cohorts and single-cell datasets.
Senescence Estimation
Estimate senescence levels and senescence-associated features in user-customed files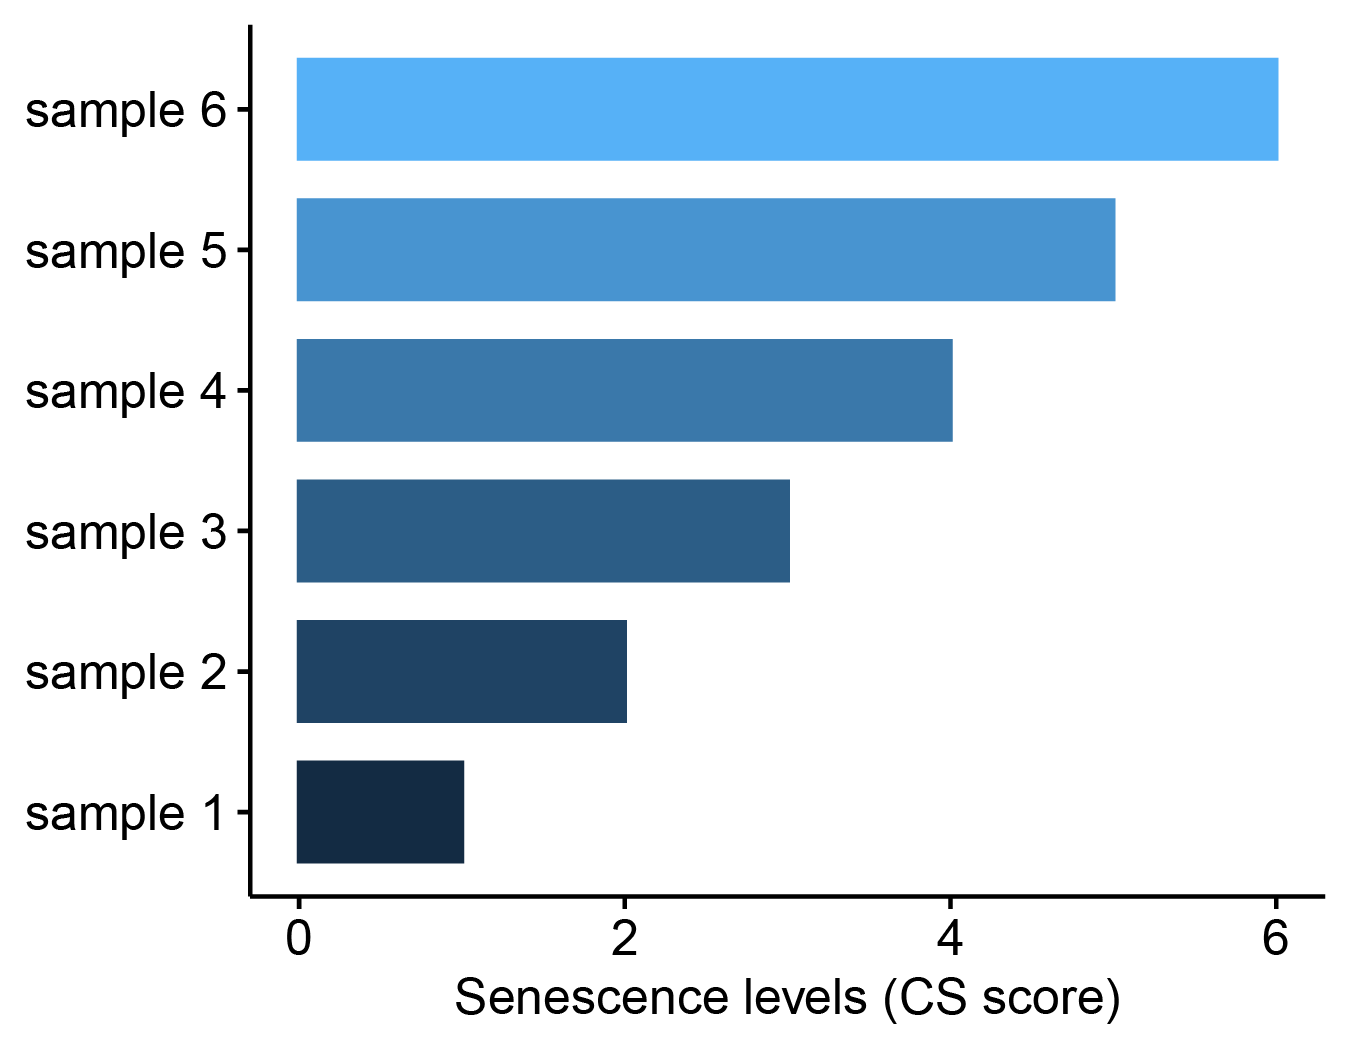
Senescence Exploration
Explore senescence-associated characteristics in TCGA, immunotherapy cohorts and single-cell datasets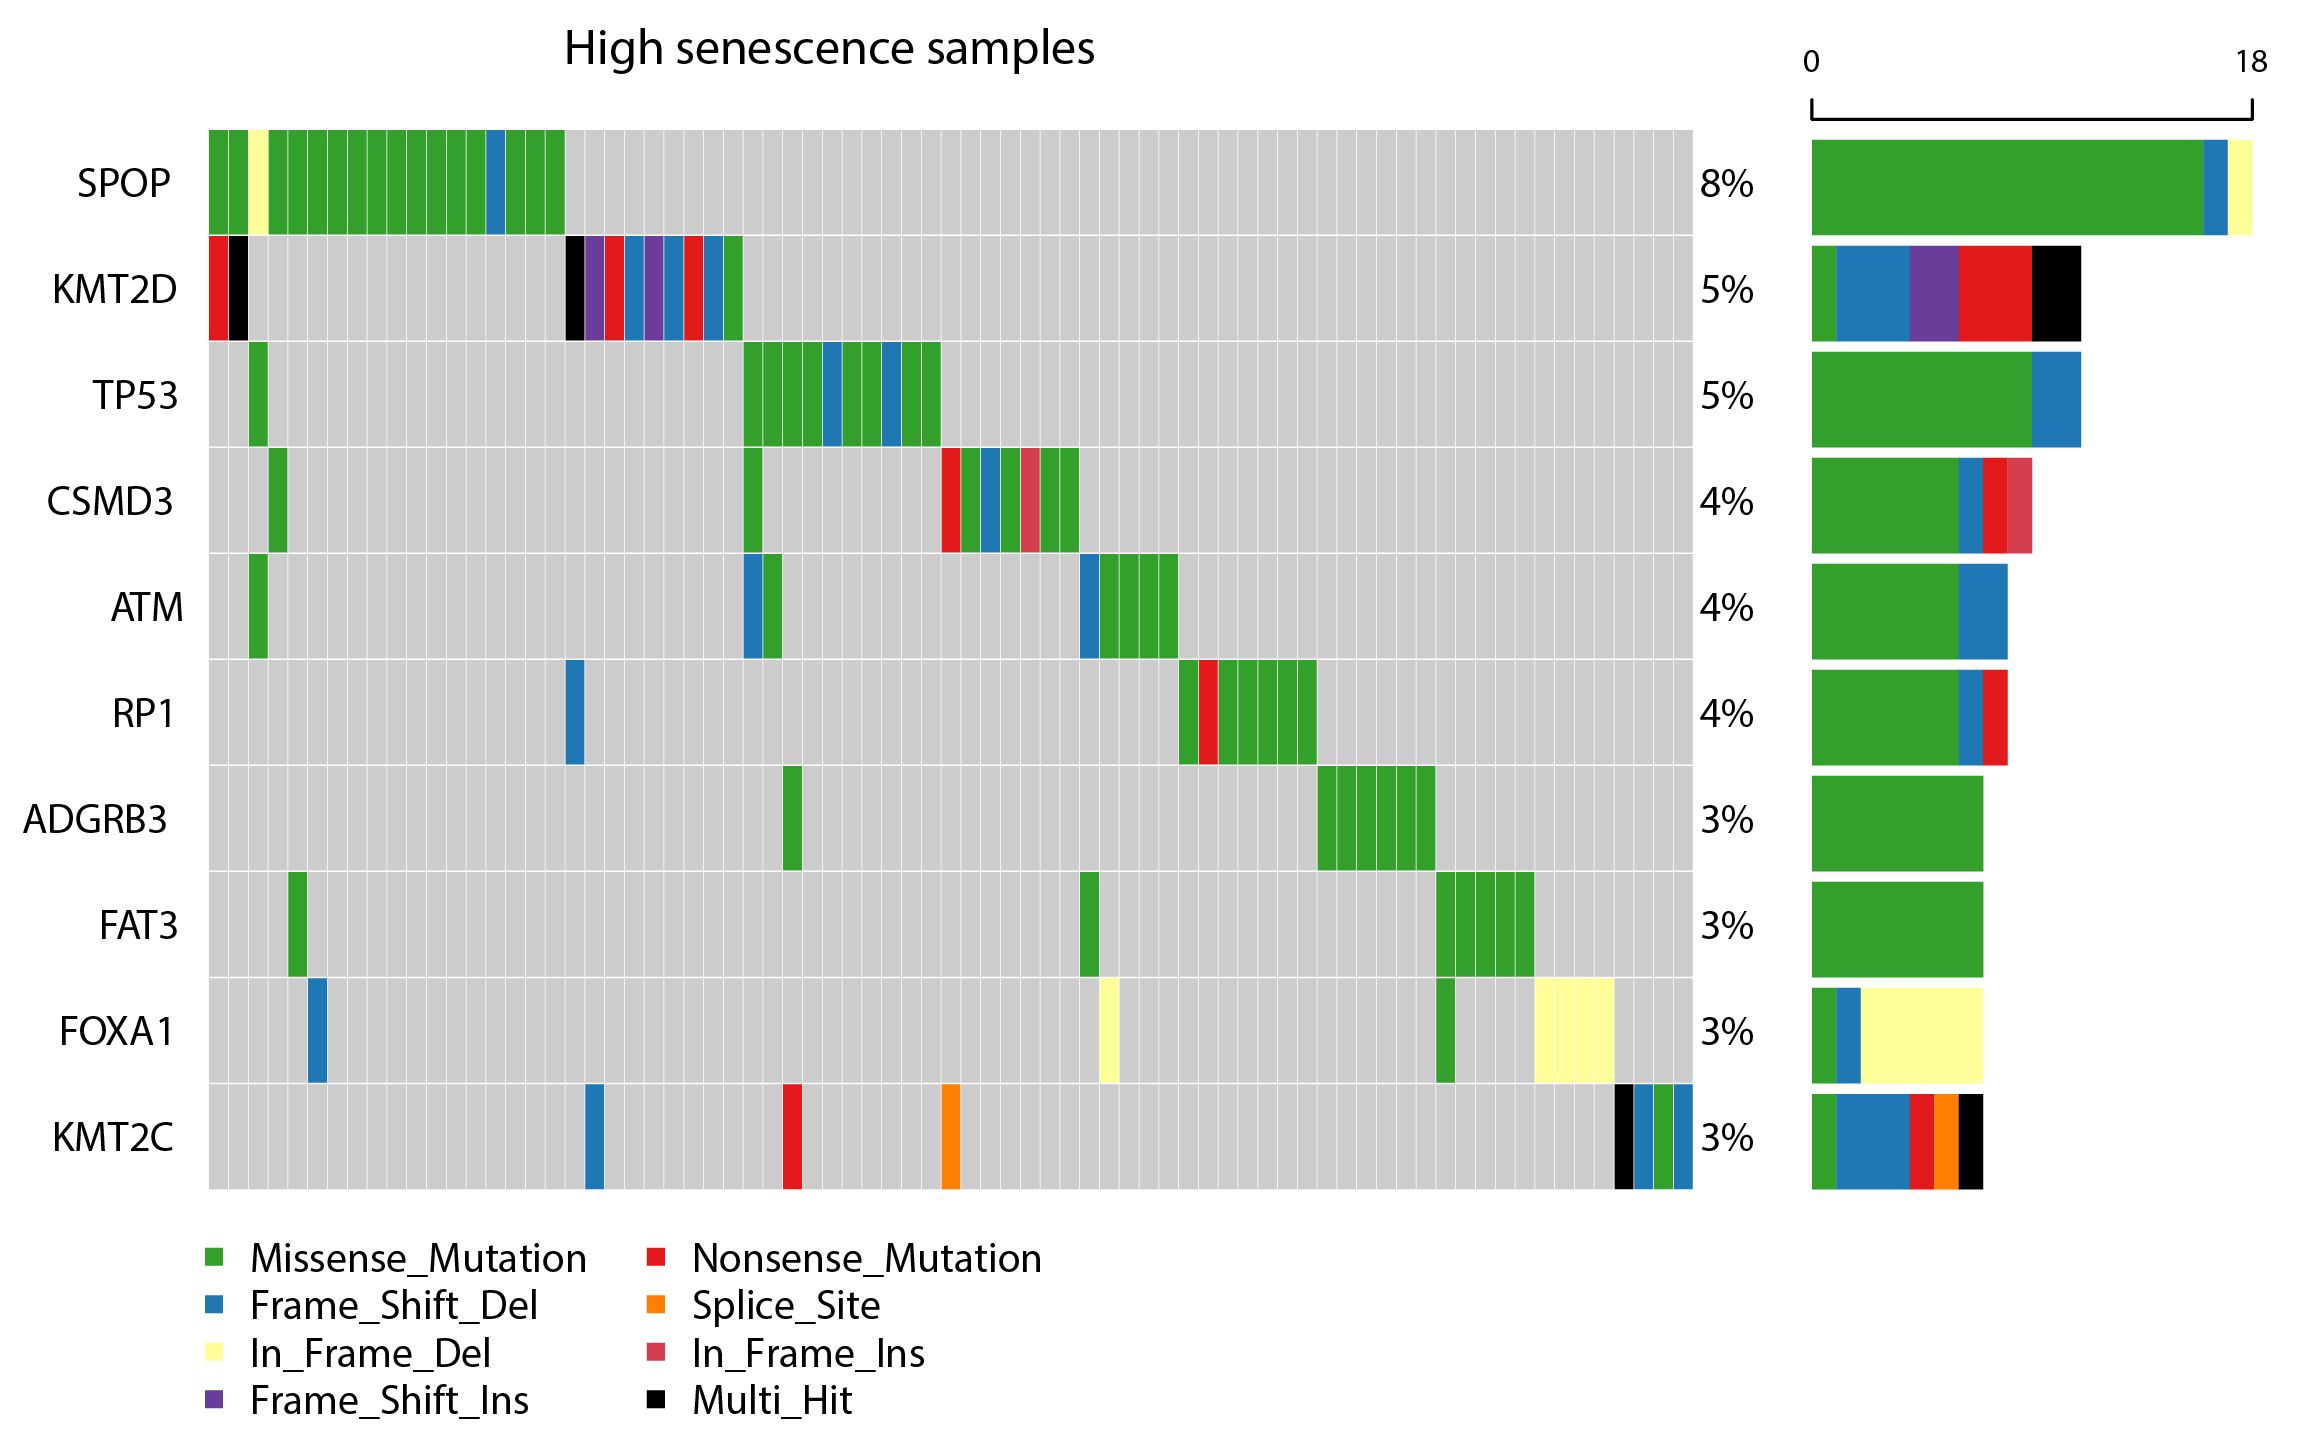
Wang X-M, Ma L-F, Pei X-Y, Wang H-P, Pei J-F, Zhang P, Wang X-Y, Wei G-H,Chen H-Z. Comprehensive assessment of cell senescence in tumor microenvironment. In preparation.
Senescence Levels Quantification & associated Genes and Cell Types Identification
Explore senescence-associated features in diverse public datasets.
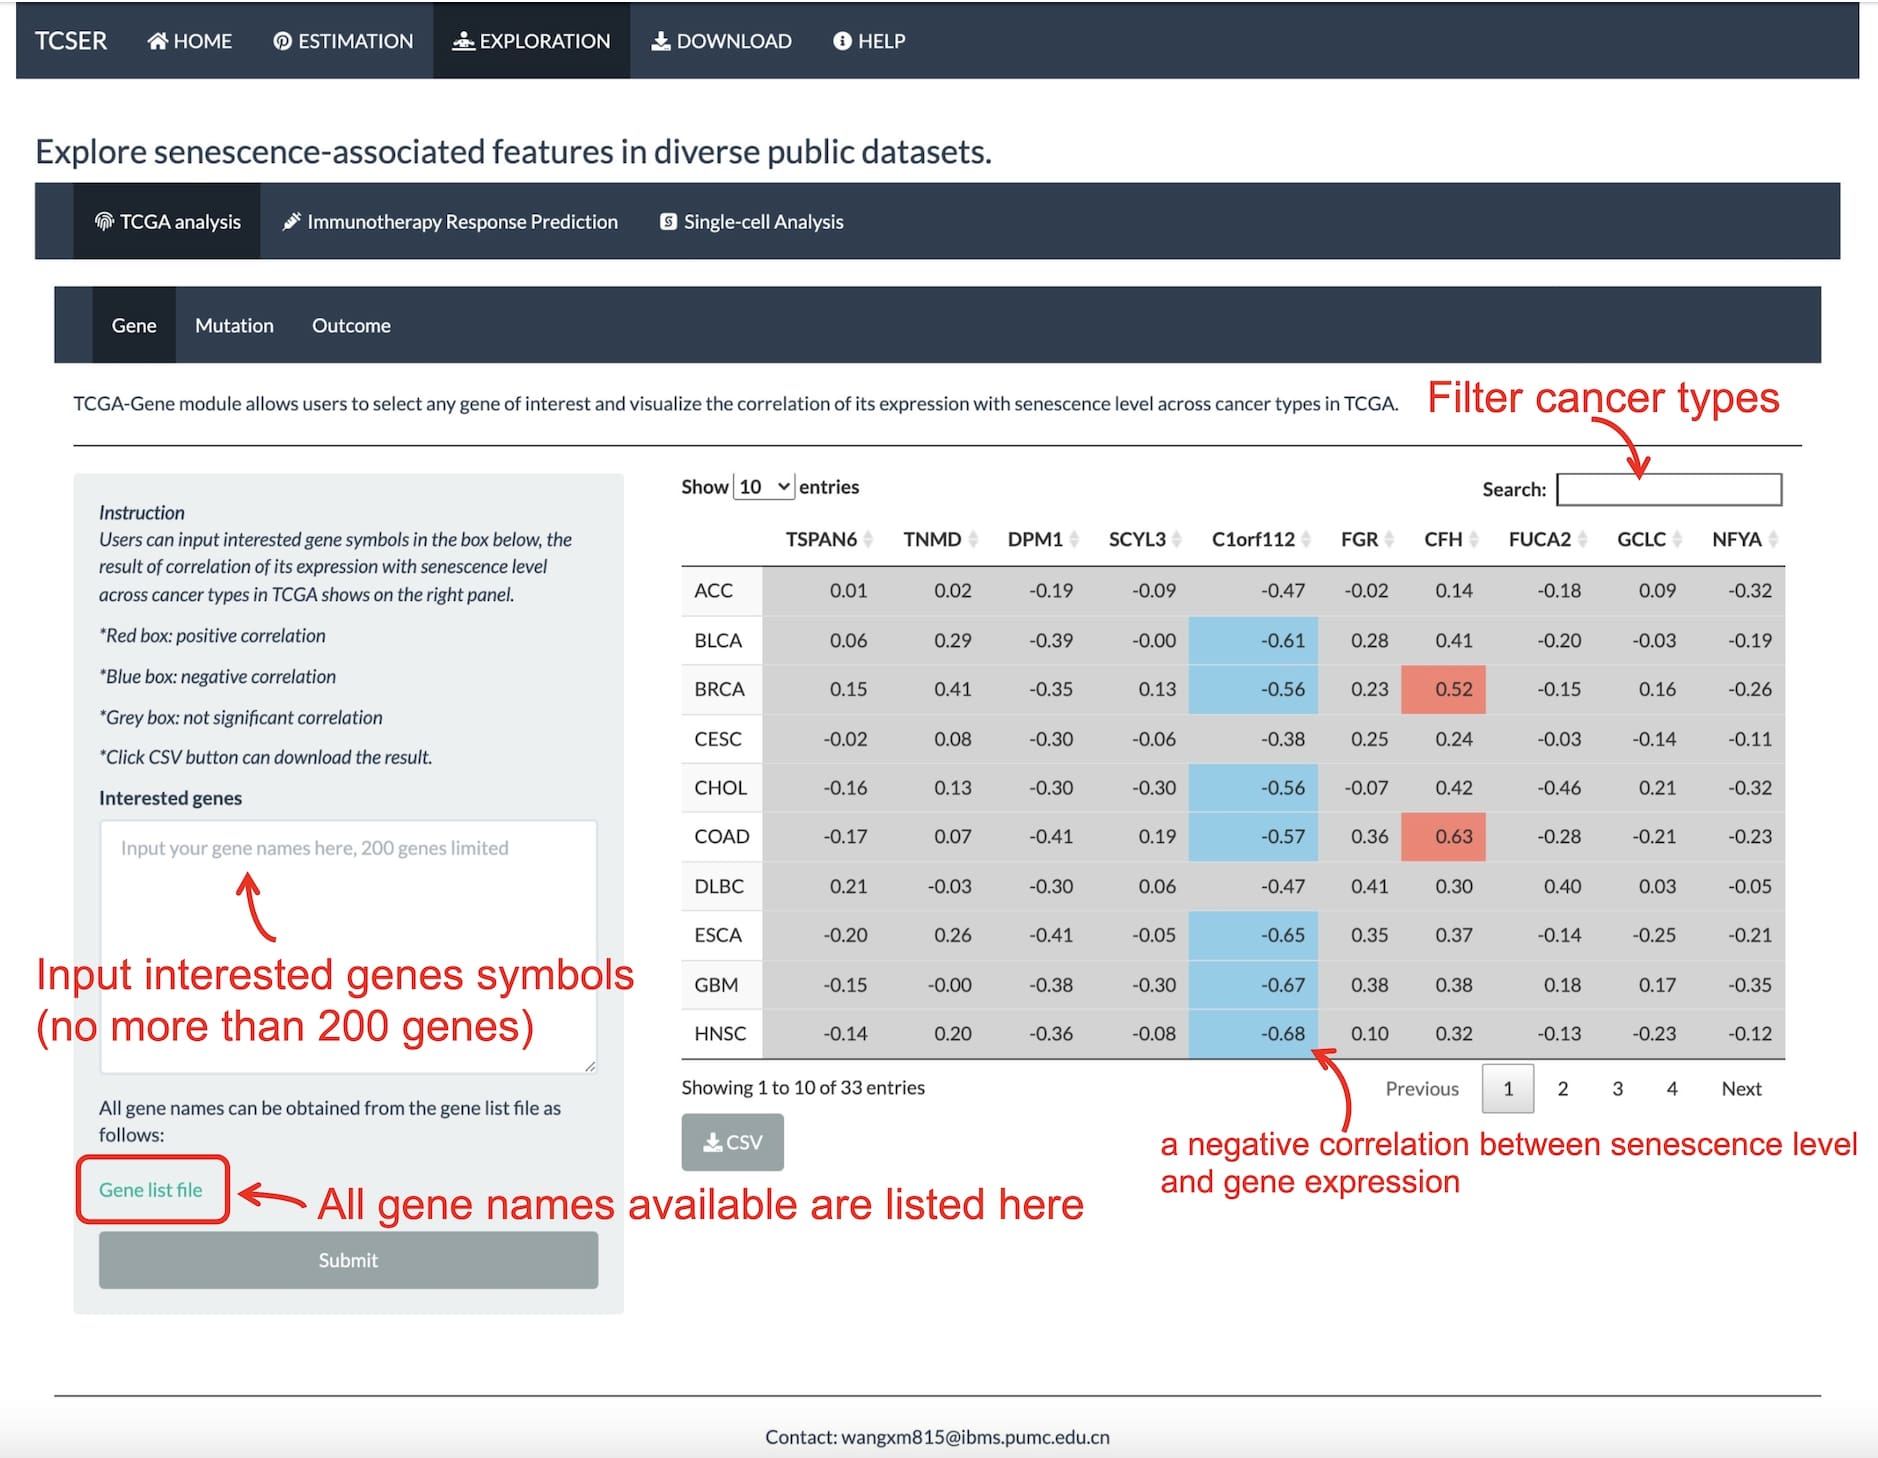
TCGA-Gene module allows users to select any gene of interest and visualize the correlation of its expression with senescence level across cancer types in TCGA.
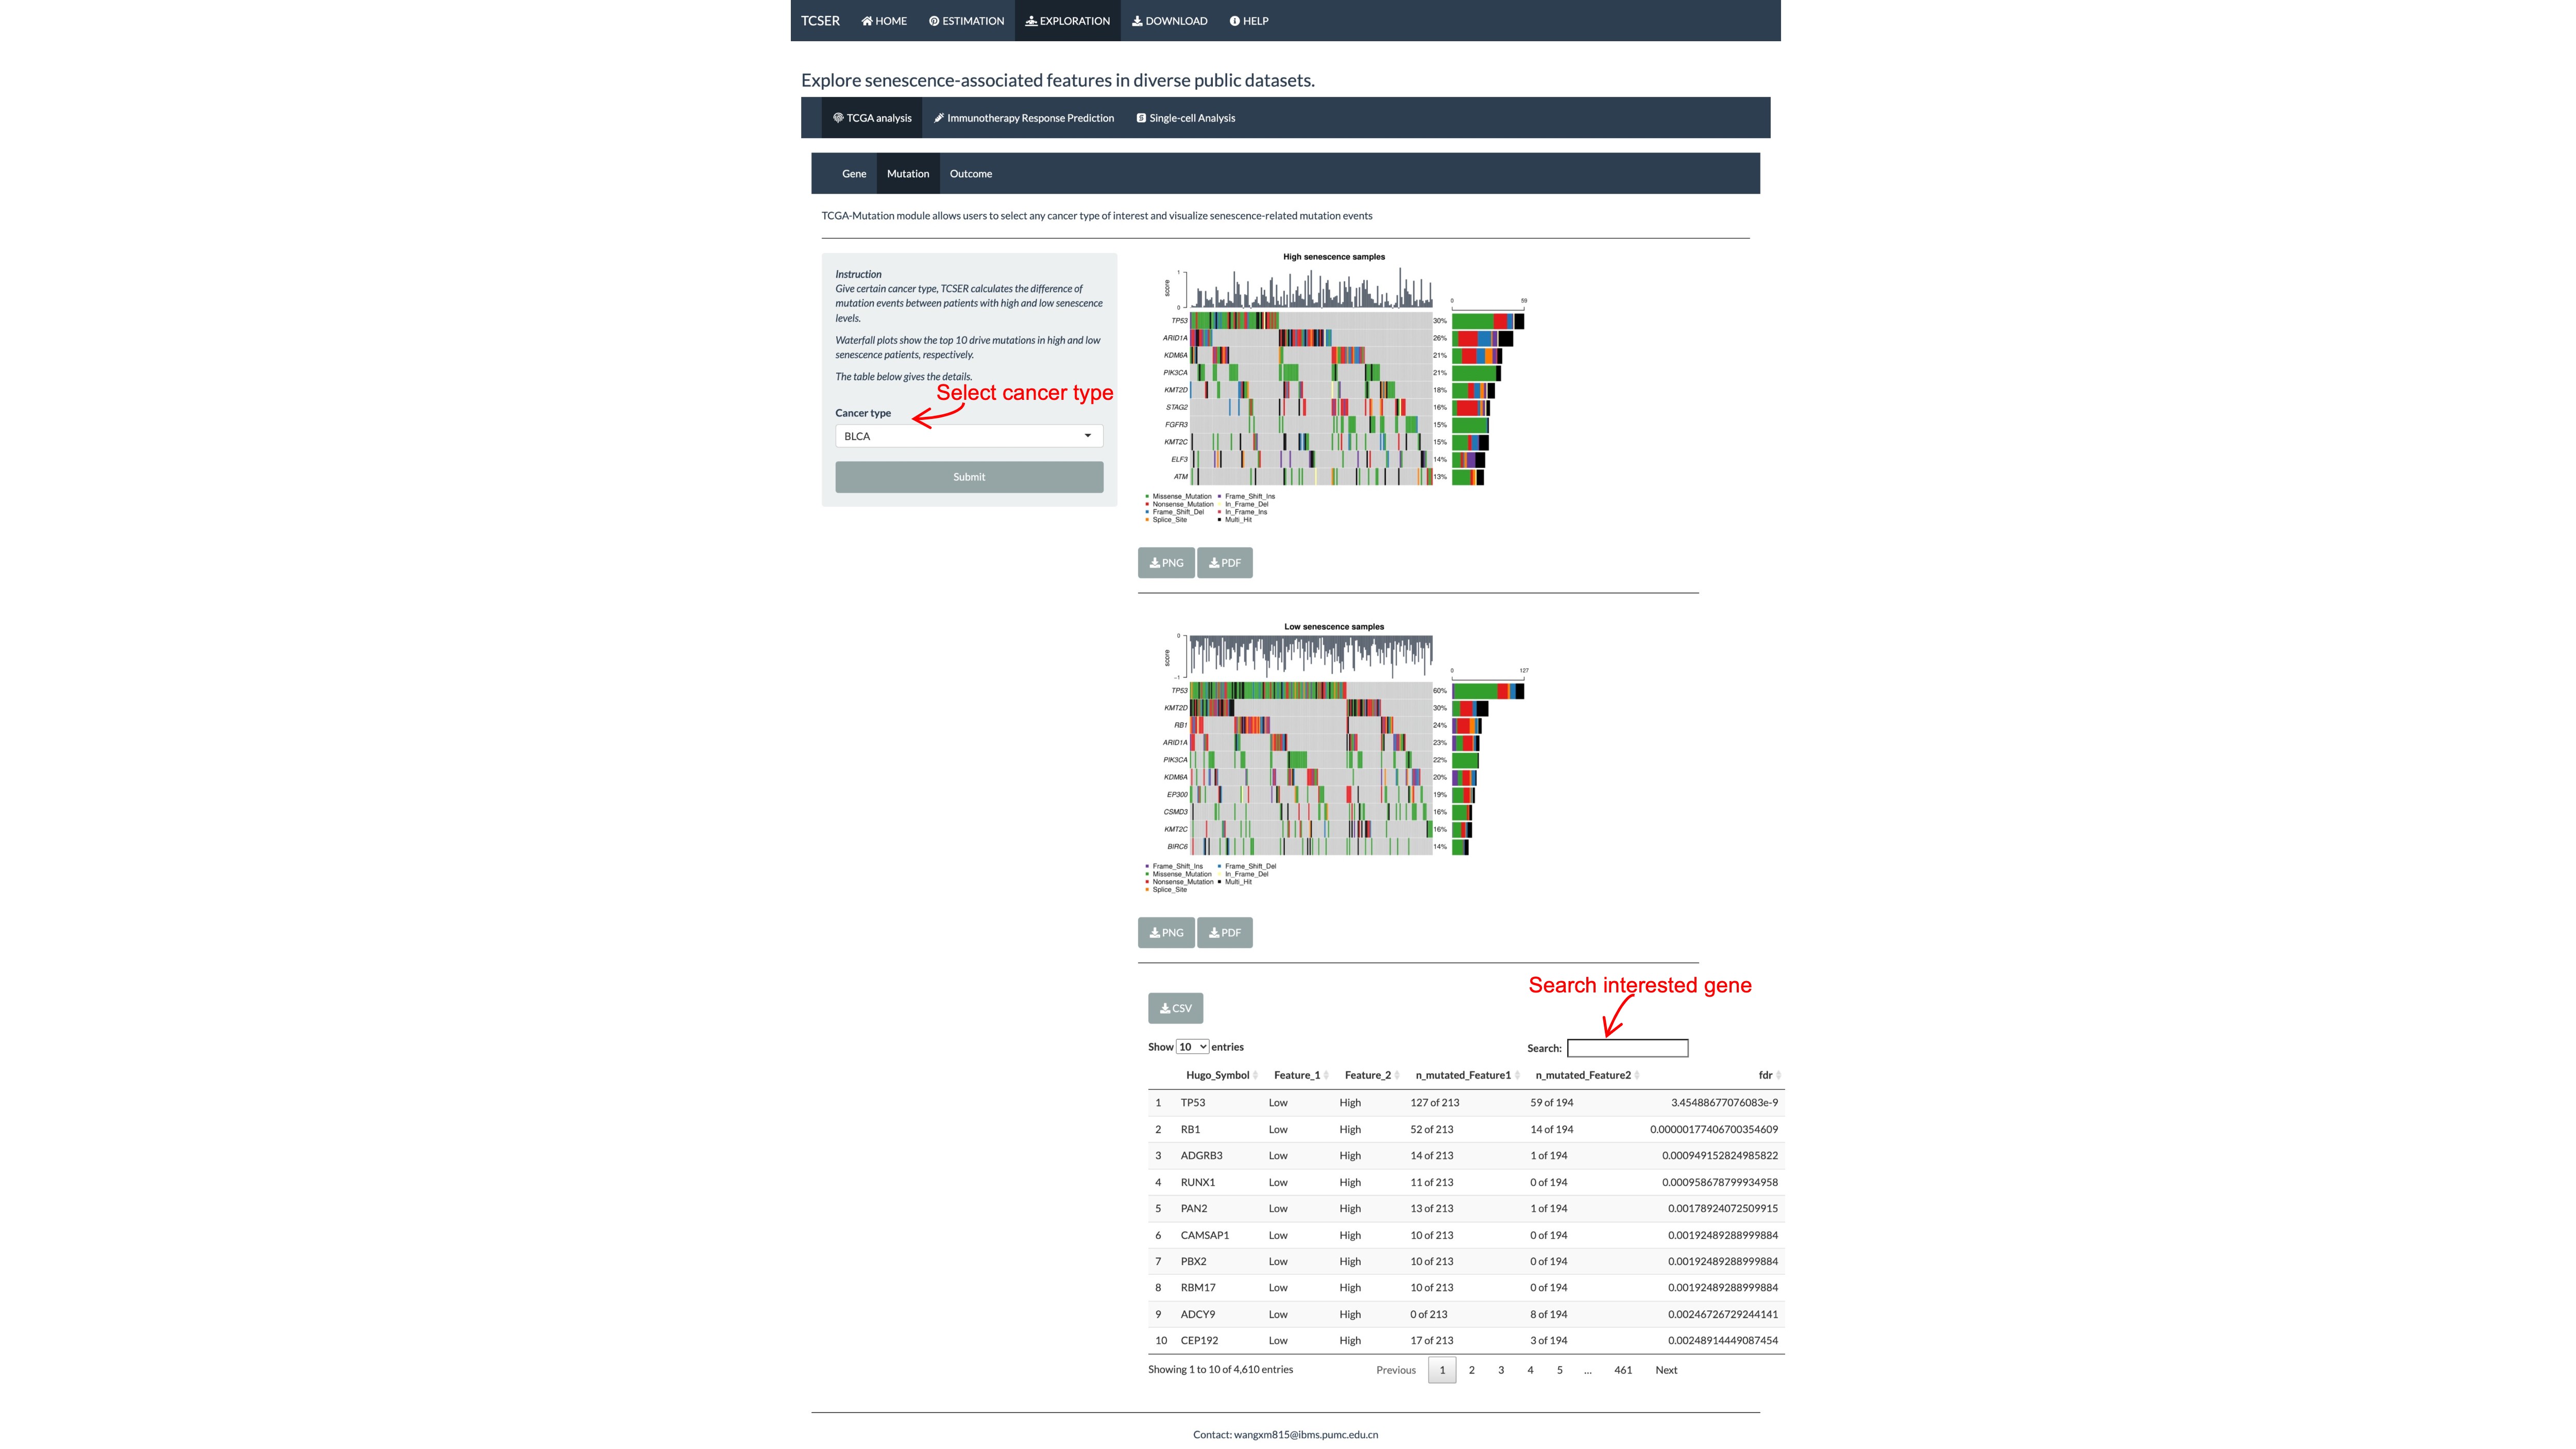
TCGA-Mutation module allows users to select any cancer type of interest and visualize senescence-related mutation events
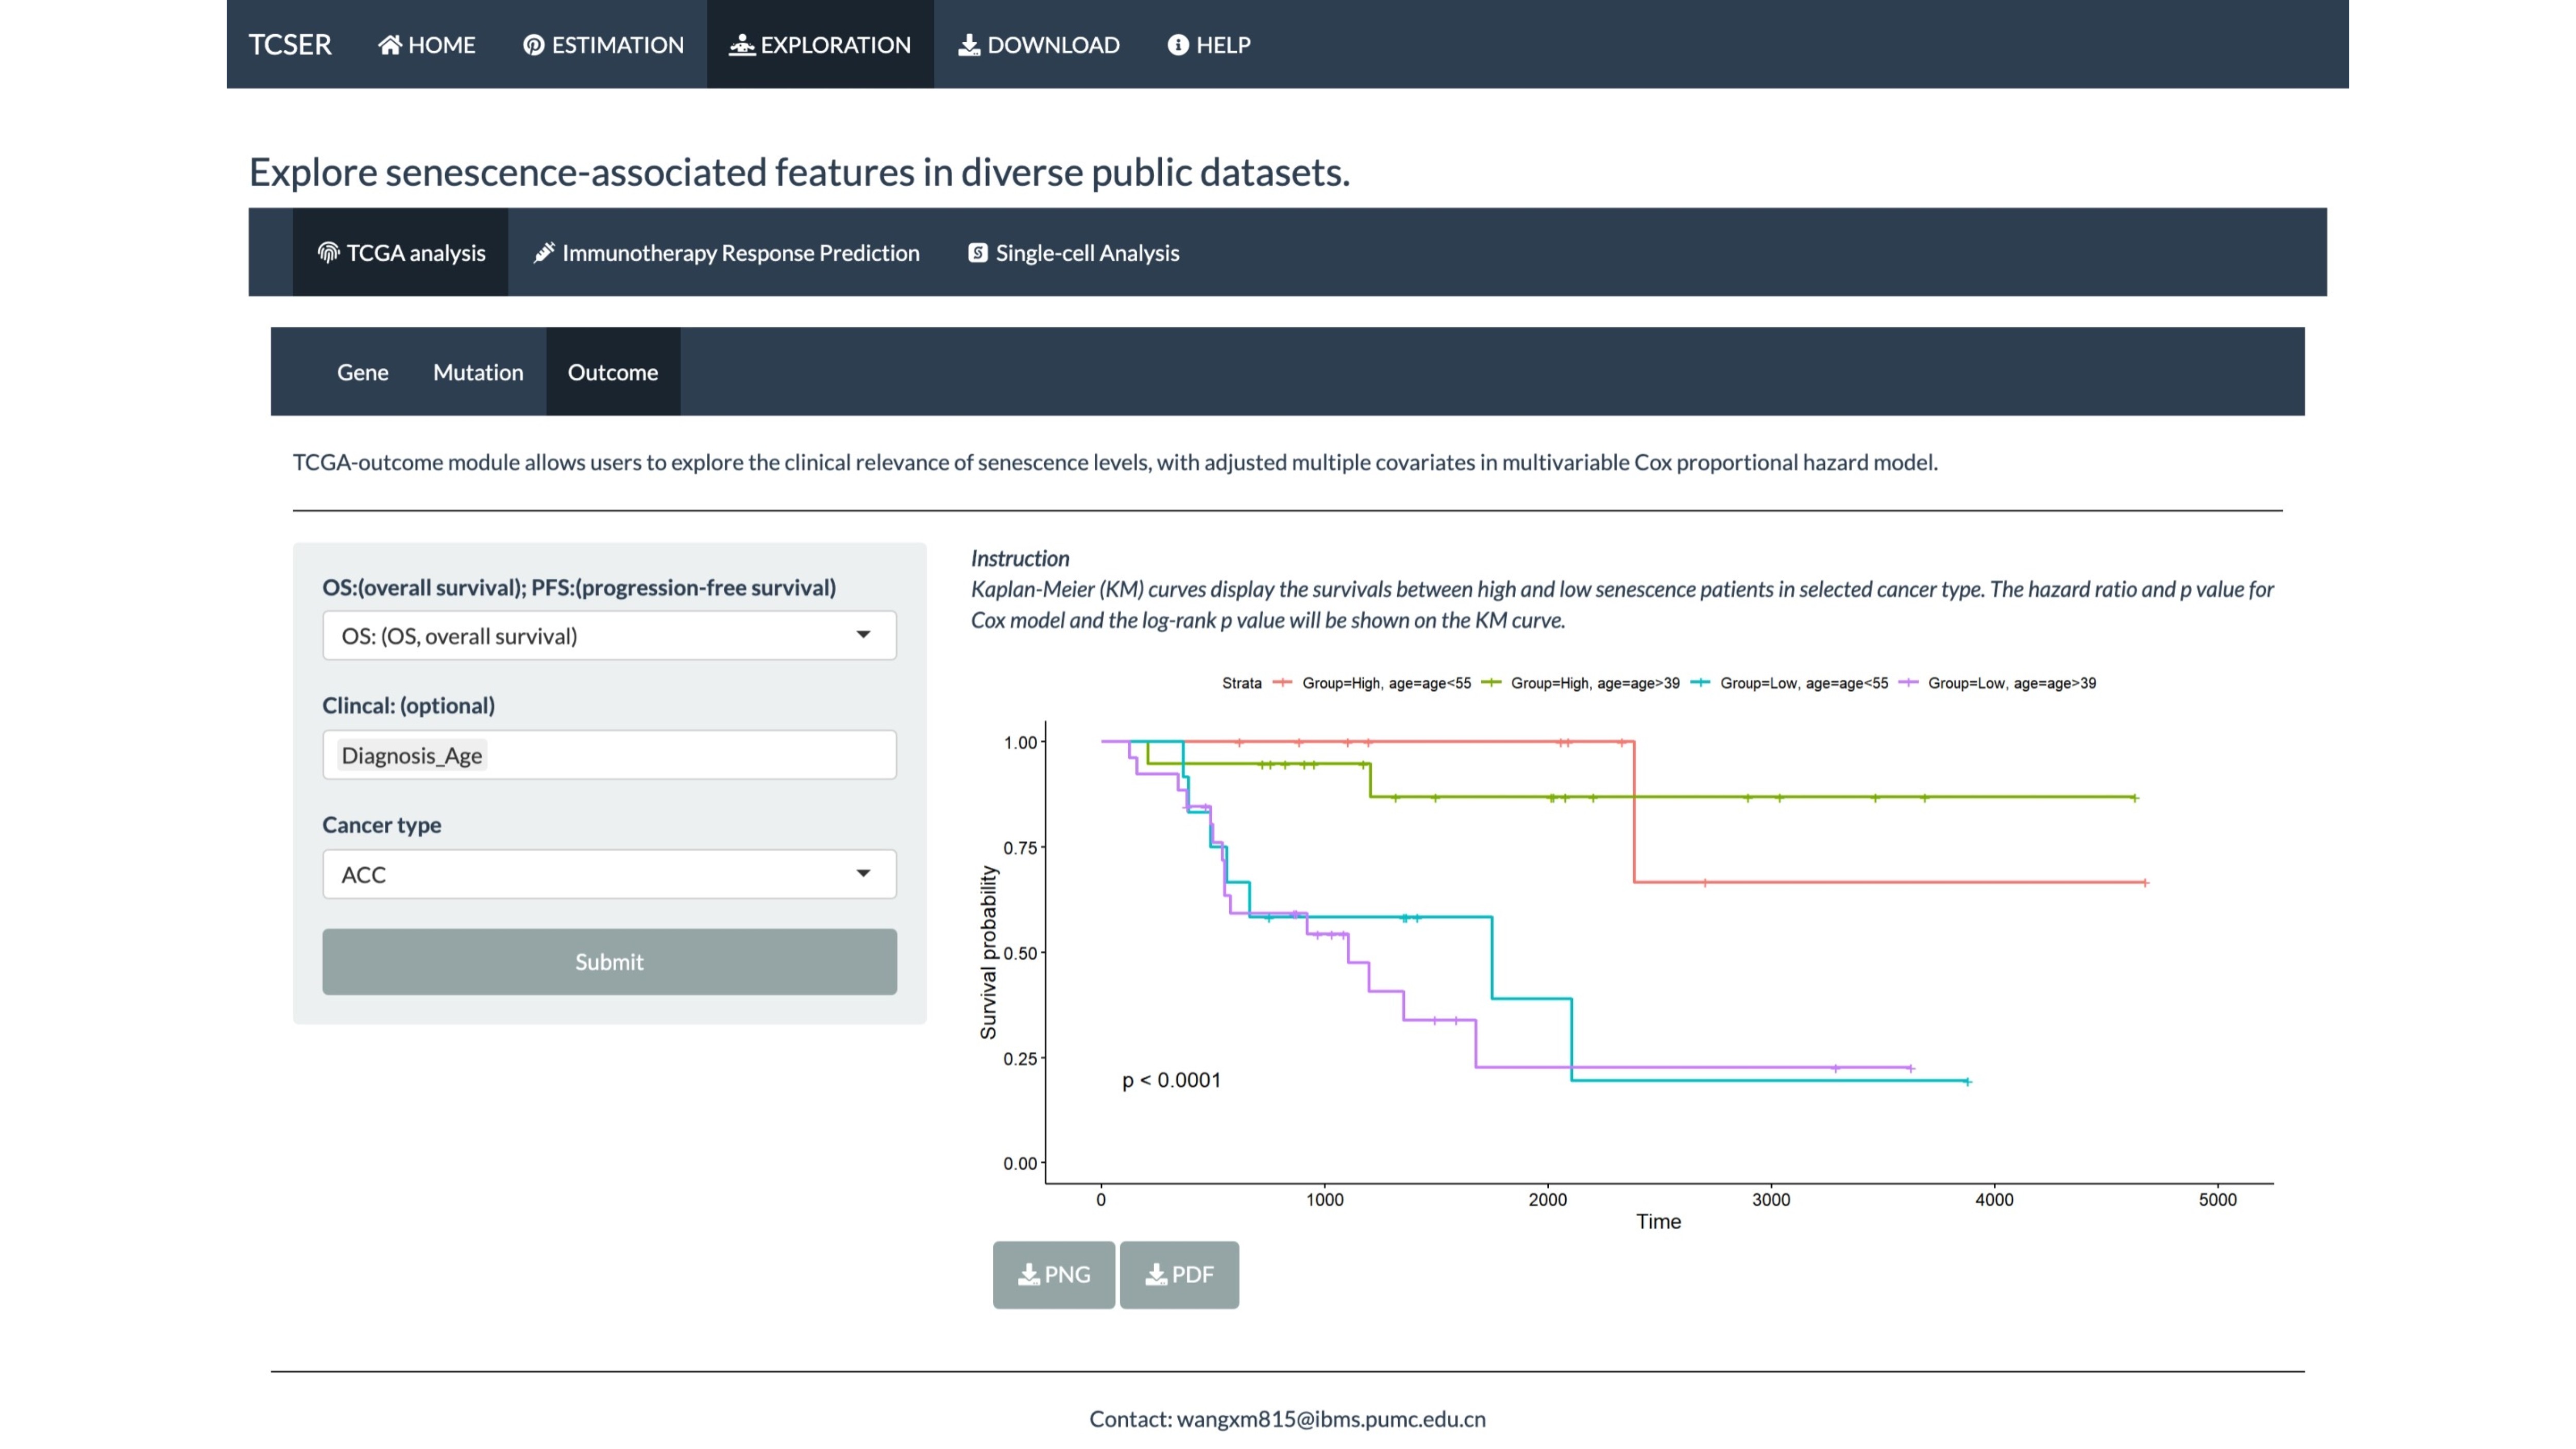
TCGA-outcome module allows users to explore the clinical relevance of senescence levels, with adjusted multiple covariates in multivariable Cox proportional hazard model.
Kaplan-Meier (KM) curves display the survivals between high and low senescence patients in selected cancer type. The hazard ratio and p value for Cox model and the log-rank p value will be shown on the KM curve.
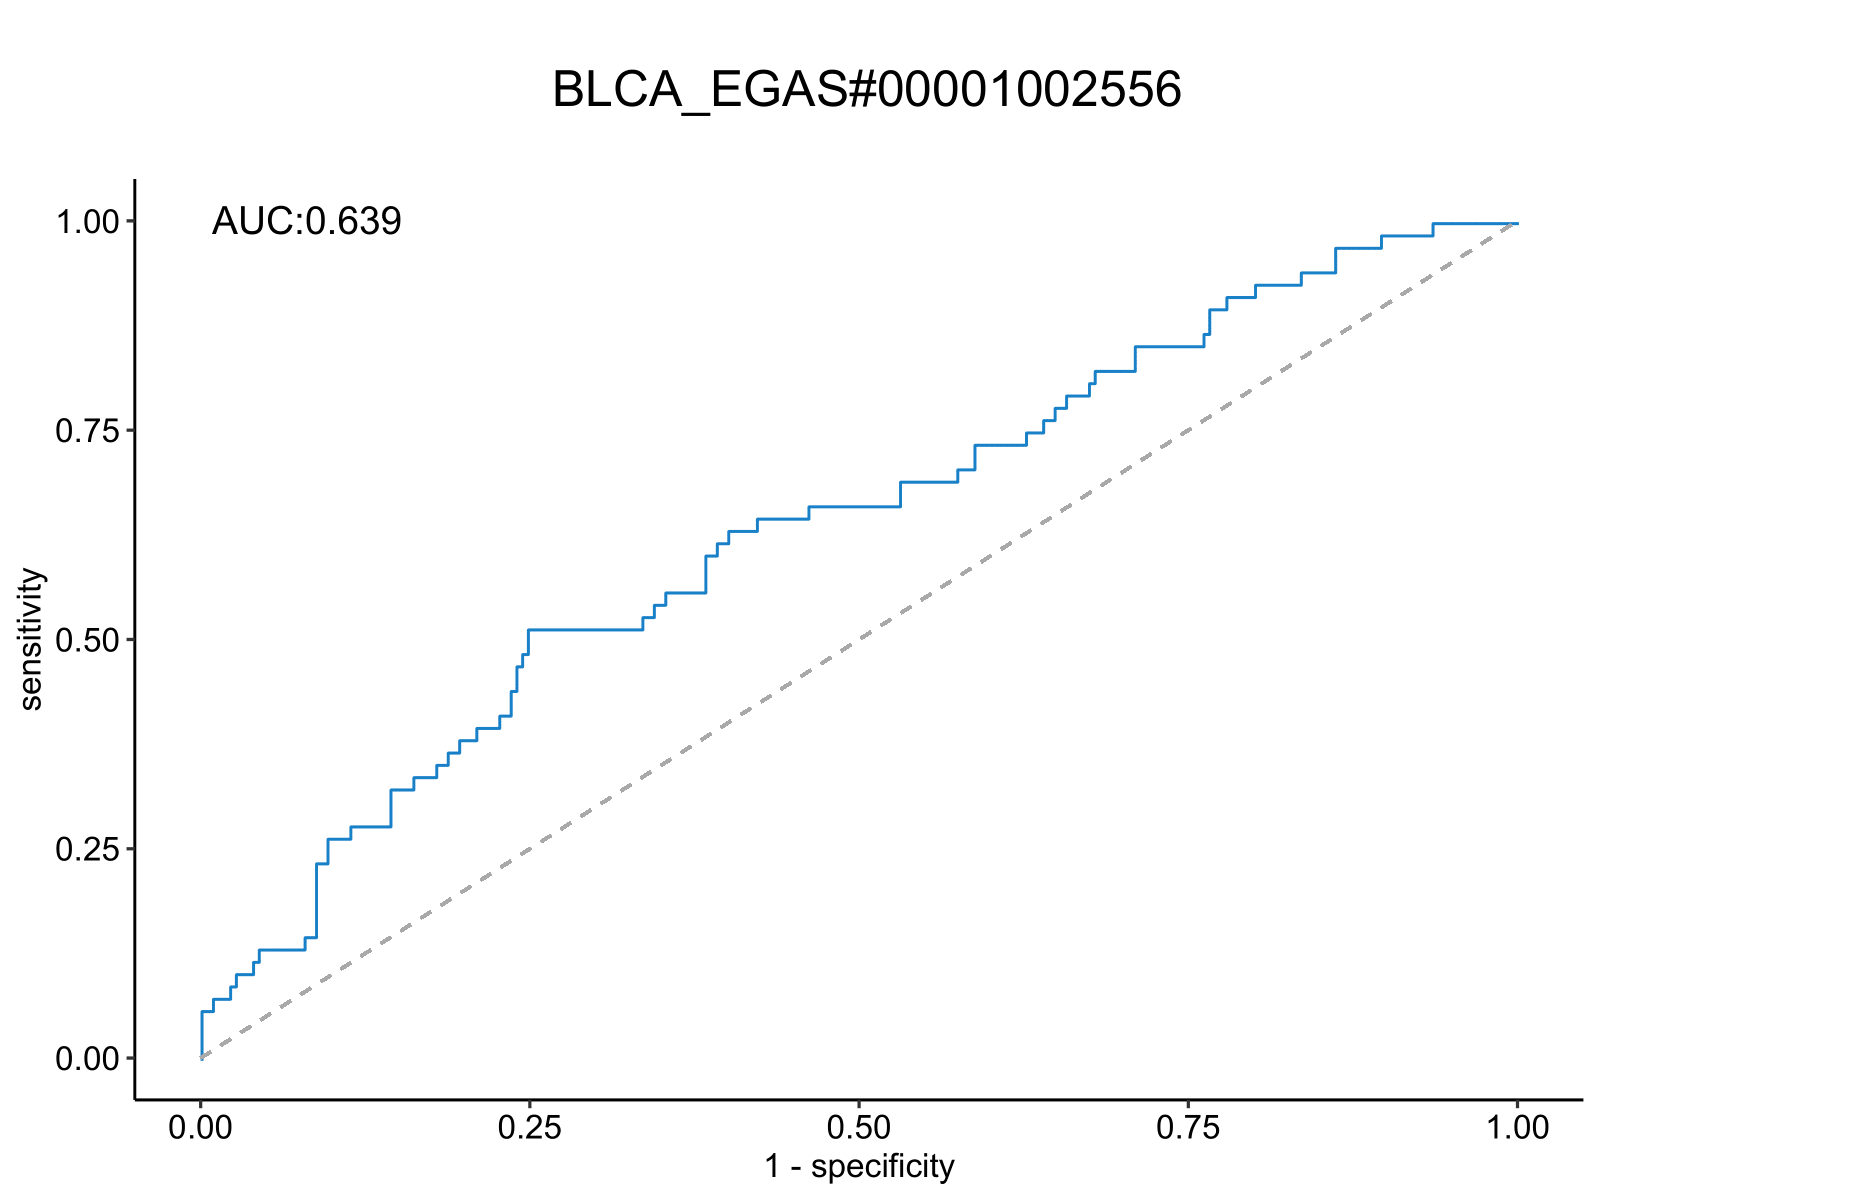
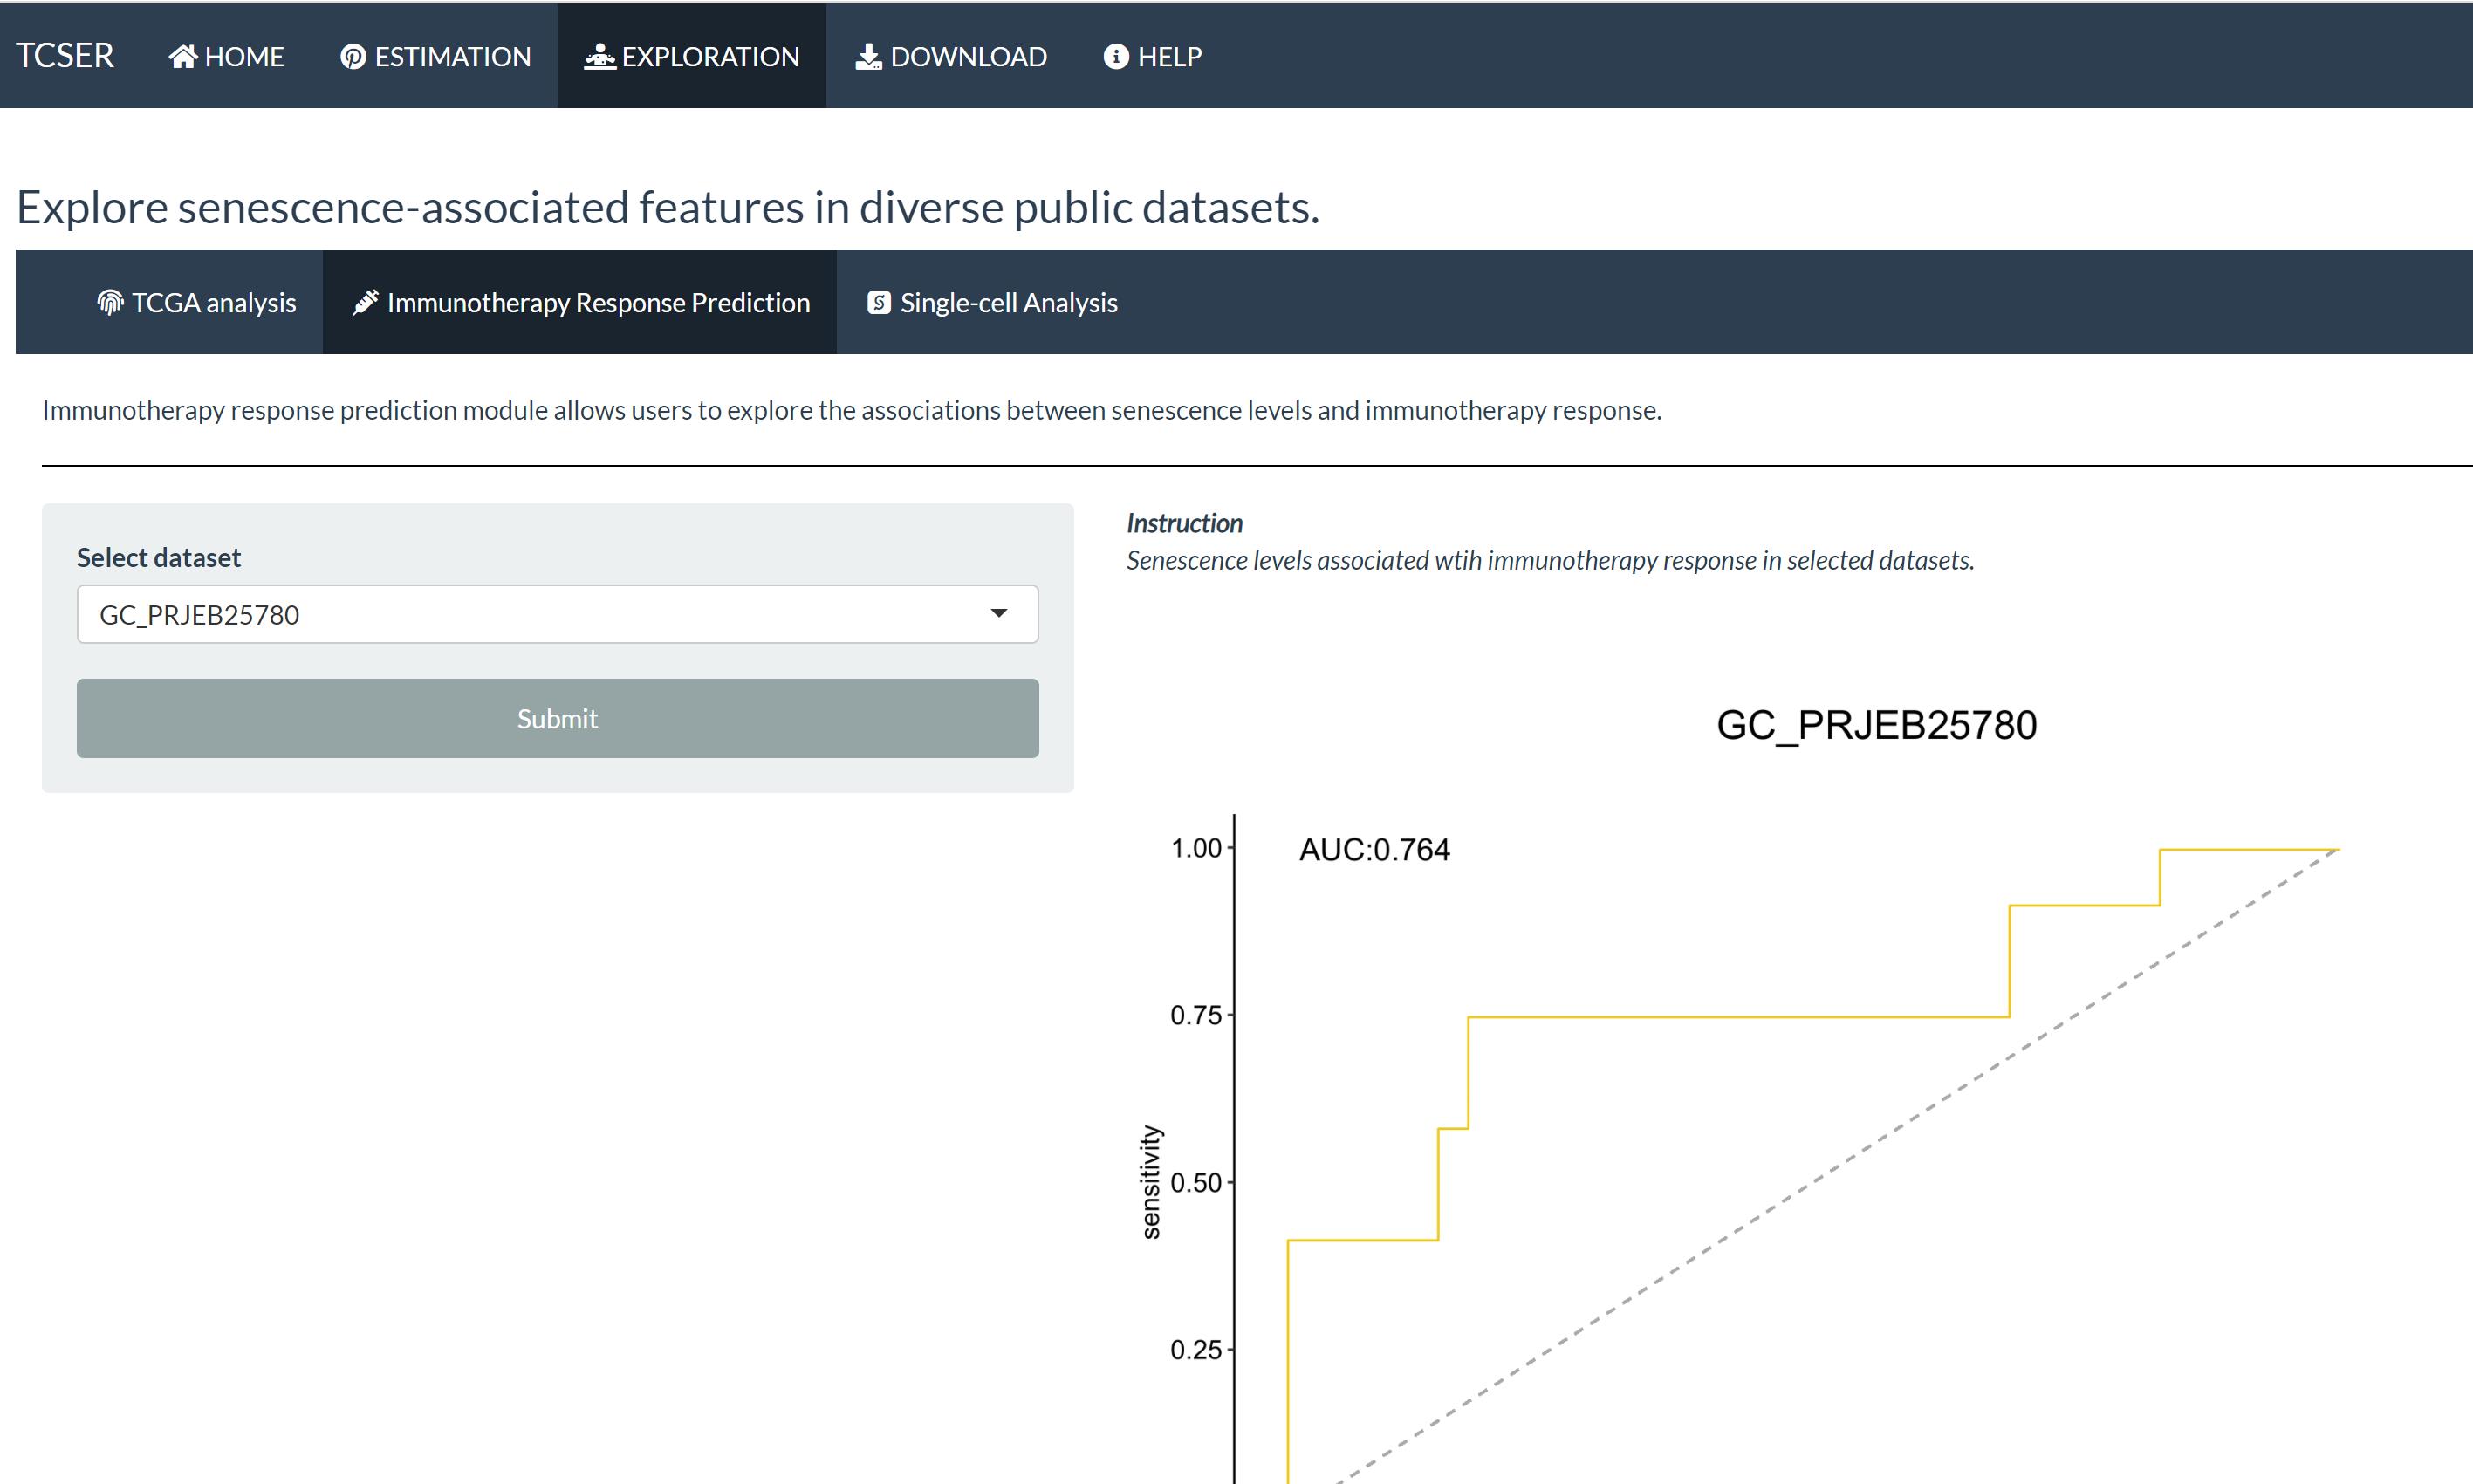
Immunotherapy response prediction module allows users to explore the associations between senescence levels and immunotherapy response.
AUC plot of selected immunotherapy datasets based on CSscore.
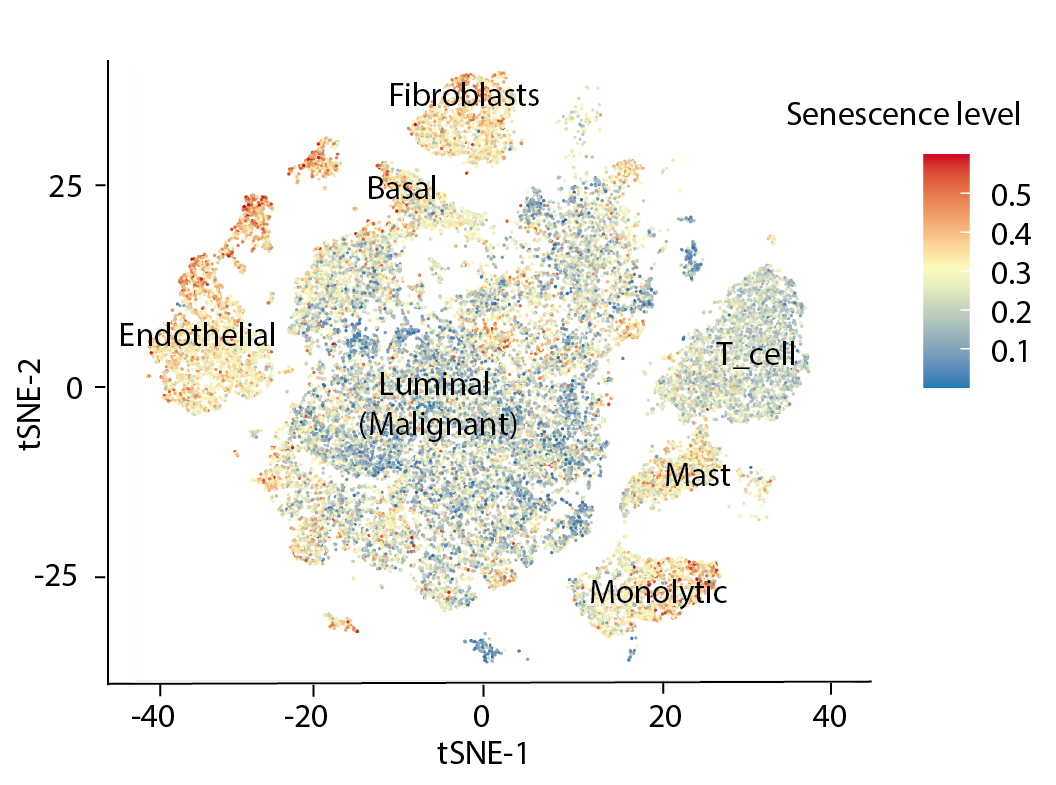
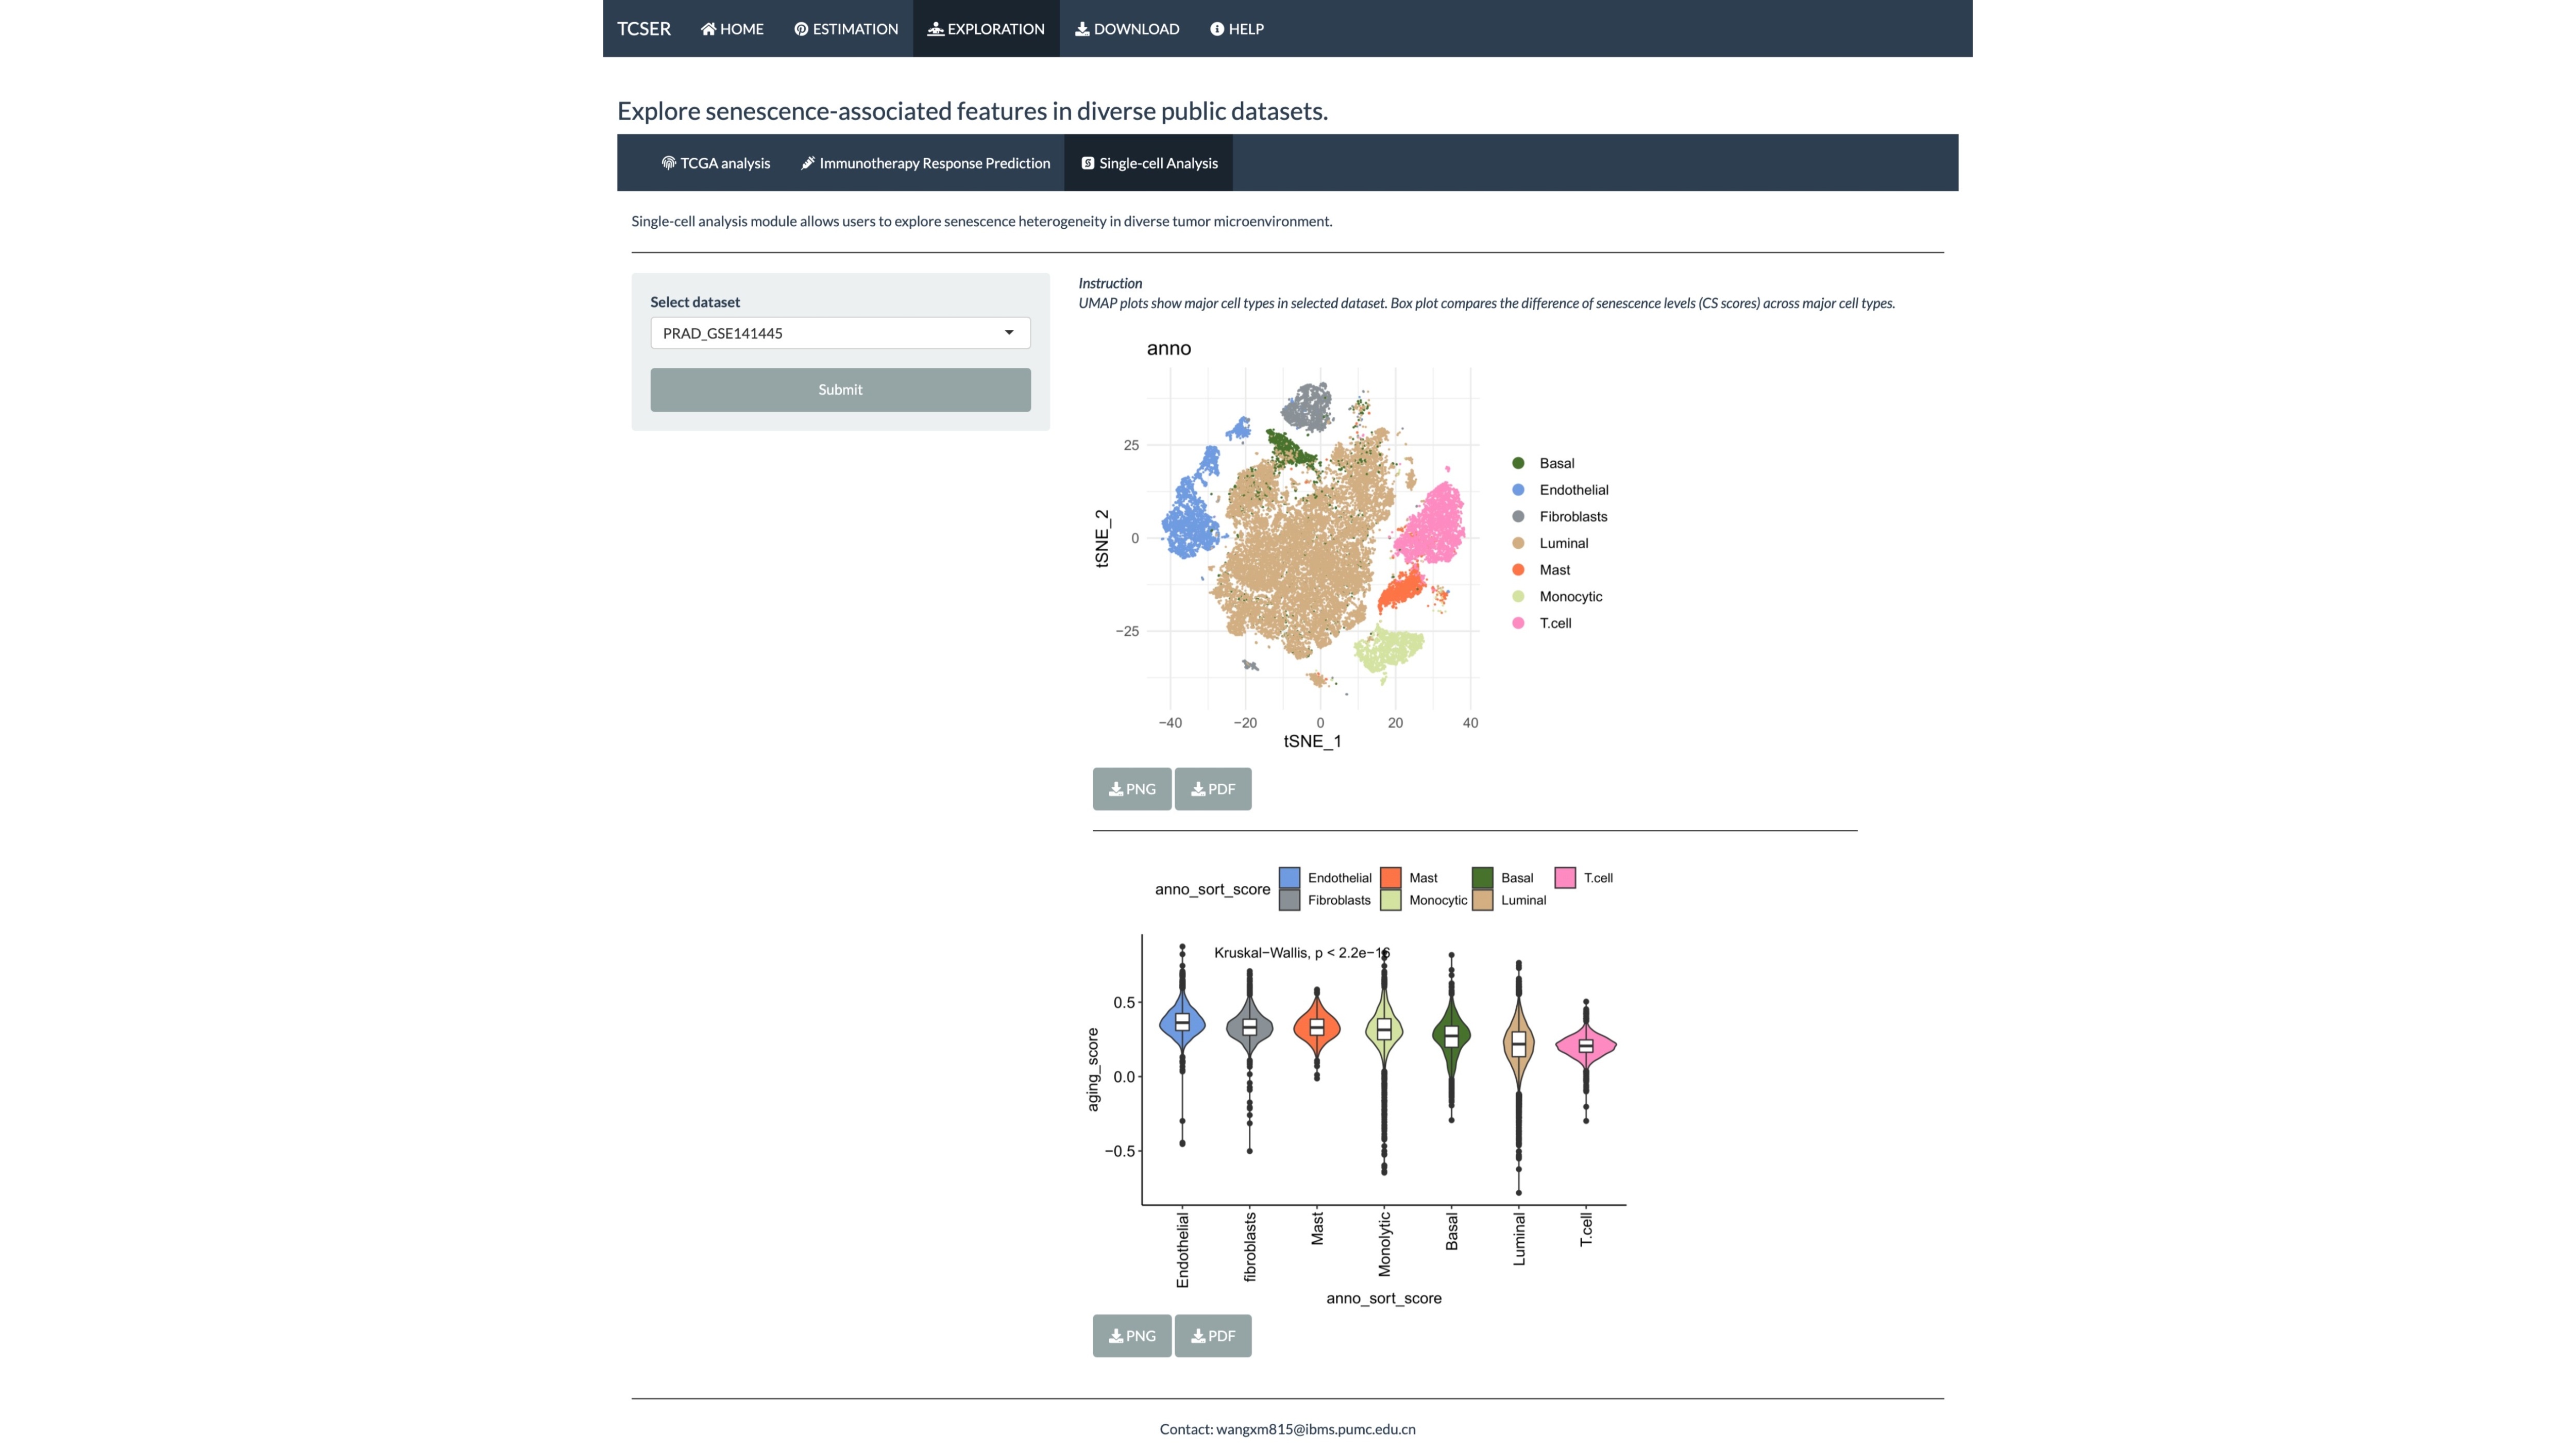
Single-cell analysis module allows users to explore senescence heterogeneity in diverse tumor microenvironment.
UMAP plots show major cell types in selected dataset. Box plot compares the difference of senescence levels (CS scores) across major cell types.
| Description | File | Type | Size |
|---|---|---|---|
| Senescence-associated survival in individual TCGA cancer types | Clinical_relevance_TCGA.csv | CSV | 1.2M |
| Gene expression matrix and corresponding clinical information of immunotherapy cohorts | Immunotherapy_cohort.rds | RDS | 33.8M |
| CS scores of all samples in TCGA | Senescence_quantification_TCGA.csv | CSV | 0.5M |
| CS scores of all cells in single-cell datasets | Senescence_quantification_single_cell.zip | ZIP | 1.9M |
| CS scores of GTEX datasets | Senescence_quantification_GTEX.csv | CSV | 0.7M |
| CS scores of immunotherapy cohorts | Senescence_quantification_immunotherapy cohorts.rds | RDS | 0.4M |
Introduction
Tumor Cellular Senescence Estimation Resource (TCSER) is a comprehensive resource for systematical quantification of cellular senescence across cancer types.
TCSER provides senescence quantification and identification of senescence-associated characteristics, and allow users to explore senescence across TCGA cancer types, immunotherapy cohorts and single-cell datasets.
Define cellular senescence (CS) scores
We established the CS score in three steps. We first collected previously curated gene sets of replicative CS that were derived from 164 distinct cell lines (1,259 genes in total), then calculated empirical cumulative distribution functions (CDFs) of gene expression ranks for genes positively and negatively correlated with CS in individual samples, and finally defined the CS score as the normalized differences in the two CDFs.
Fig. 1 Workflow of TCSER
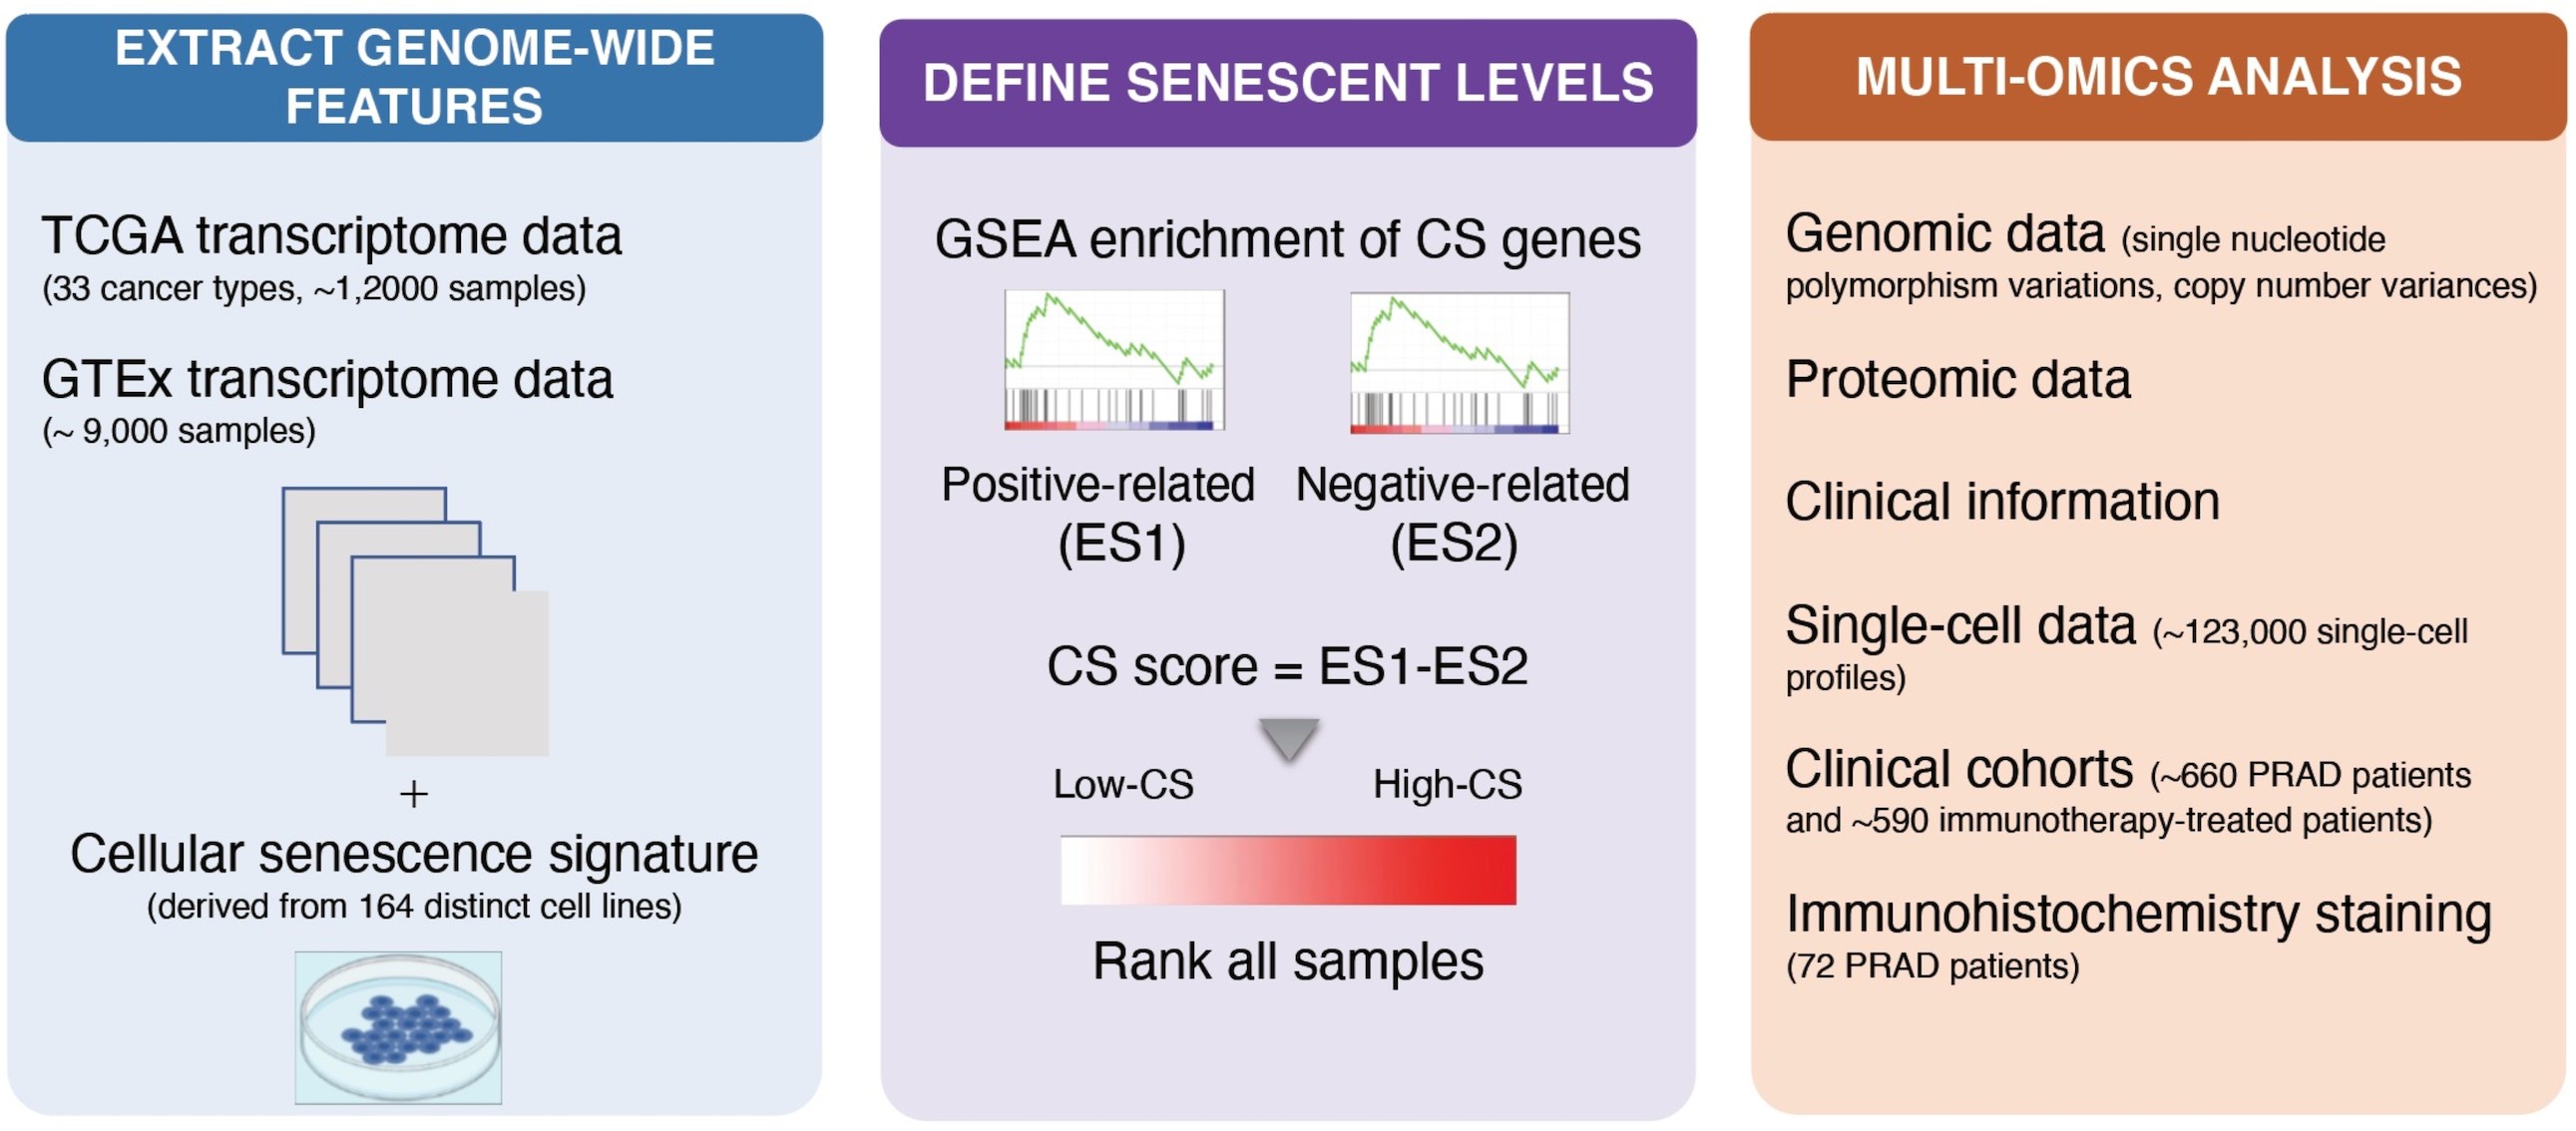
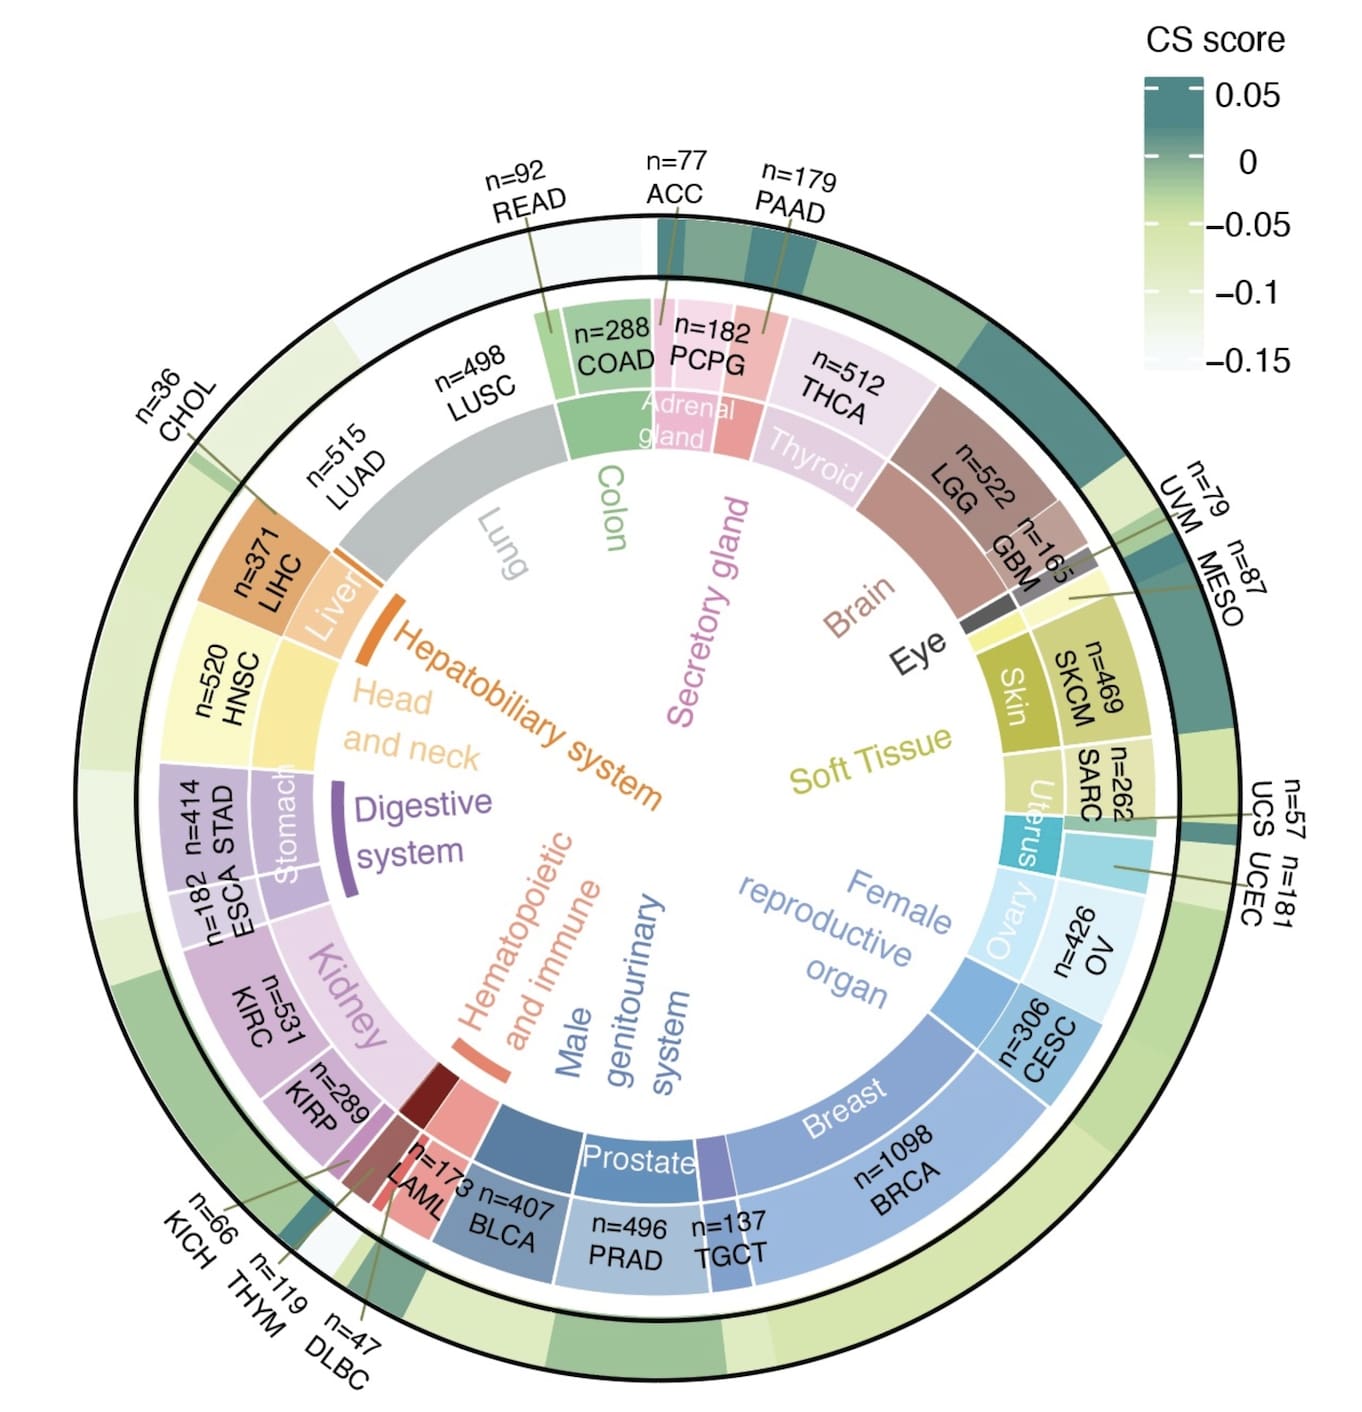
We collected data from TCGA including 33 cancer types, then quantified CS scores in individual cancer types.
Fig. 2 Average CS scores in individual cancer types
Function of TCSER
*Estimation of senescence level in user-customed file
Users are allowed to upload gene expression matrix and the website will generate high-quality figures to estimate CS score across samples, and list CS correlated genes and CS correlated cell types.
*Exploration of senescence landscape in pan-cancer levels
We also explored the associations between CS scores with genomic variations and applied CS scores in predicting patient survival and immunotherapies responses. In addition, we applied CS scores to 7 public single-cell transcriptome datasets and compared the difference of CS scores across major cell types.
Estimation of senescence levels
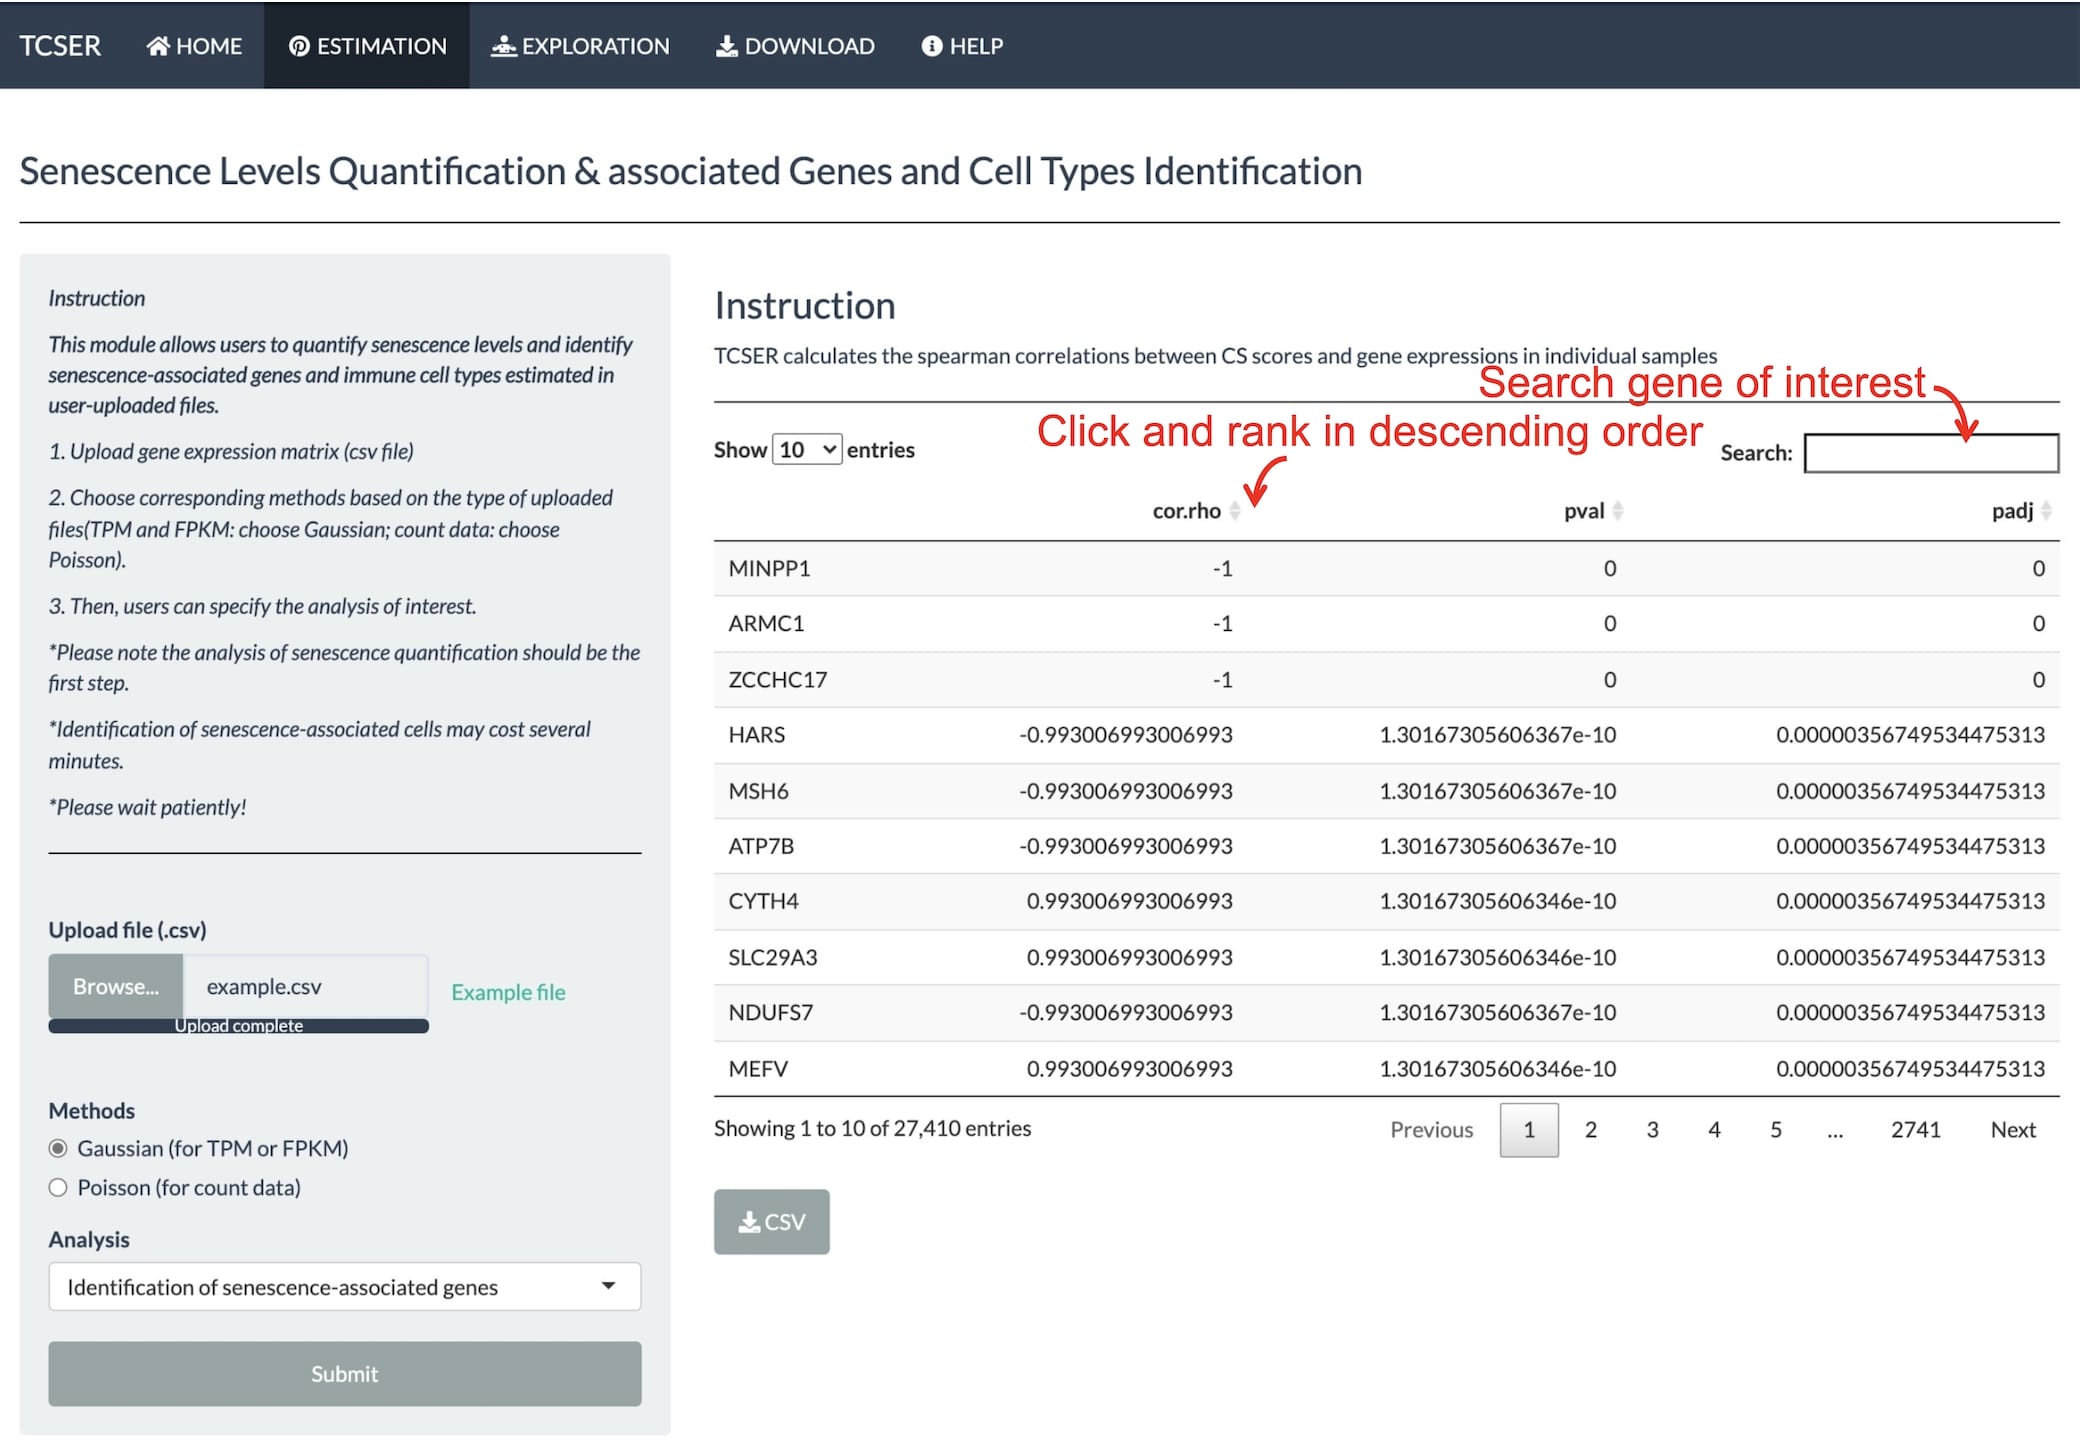
In the senescence estimation section, users are allowed to upload gene expression matrix (csv file) and specify the analysis of interest.
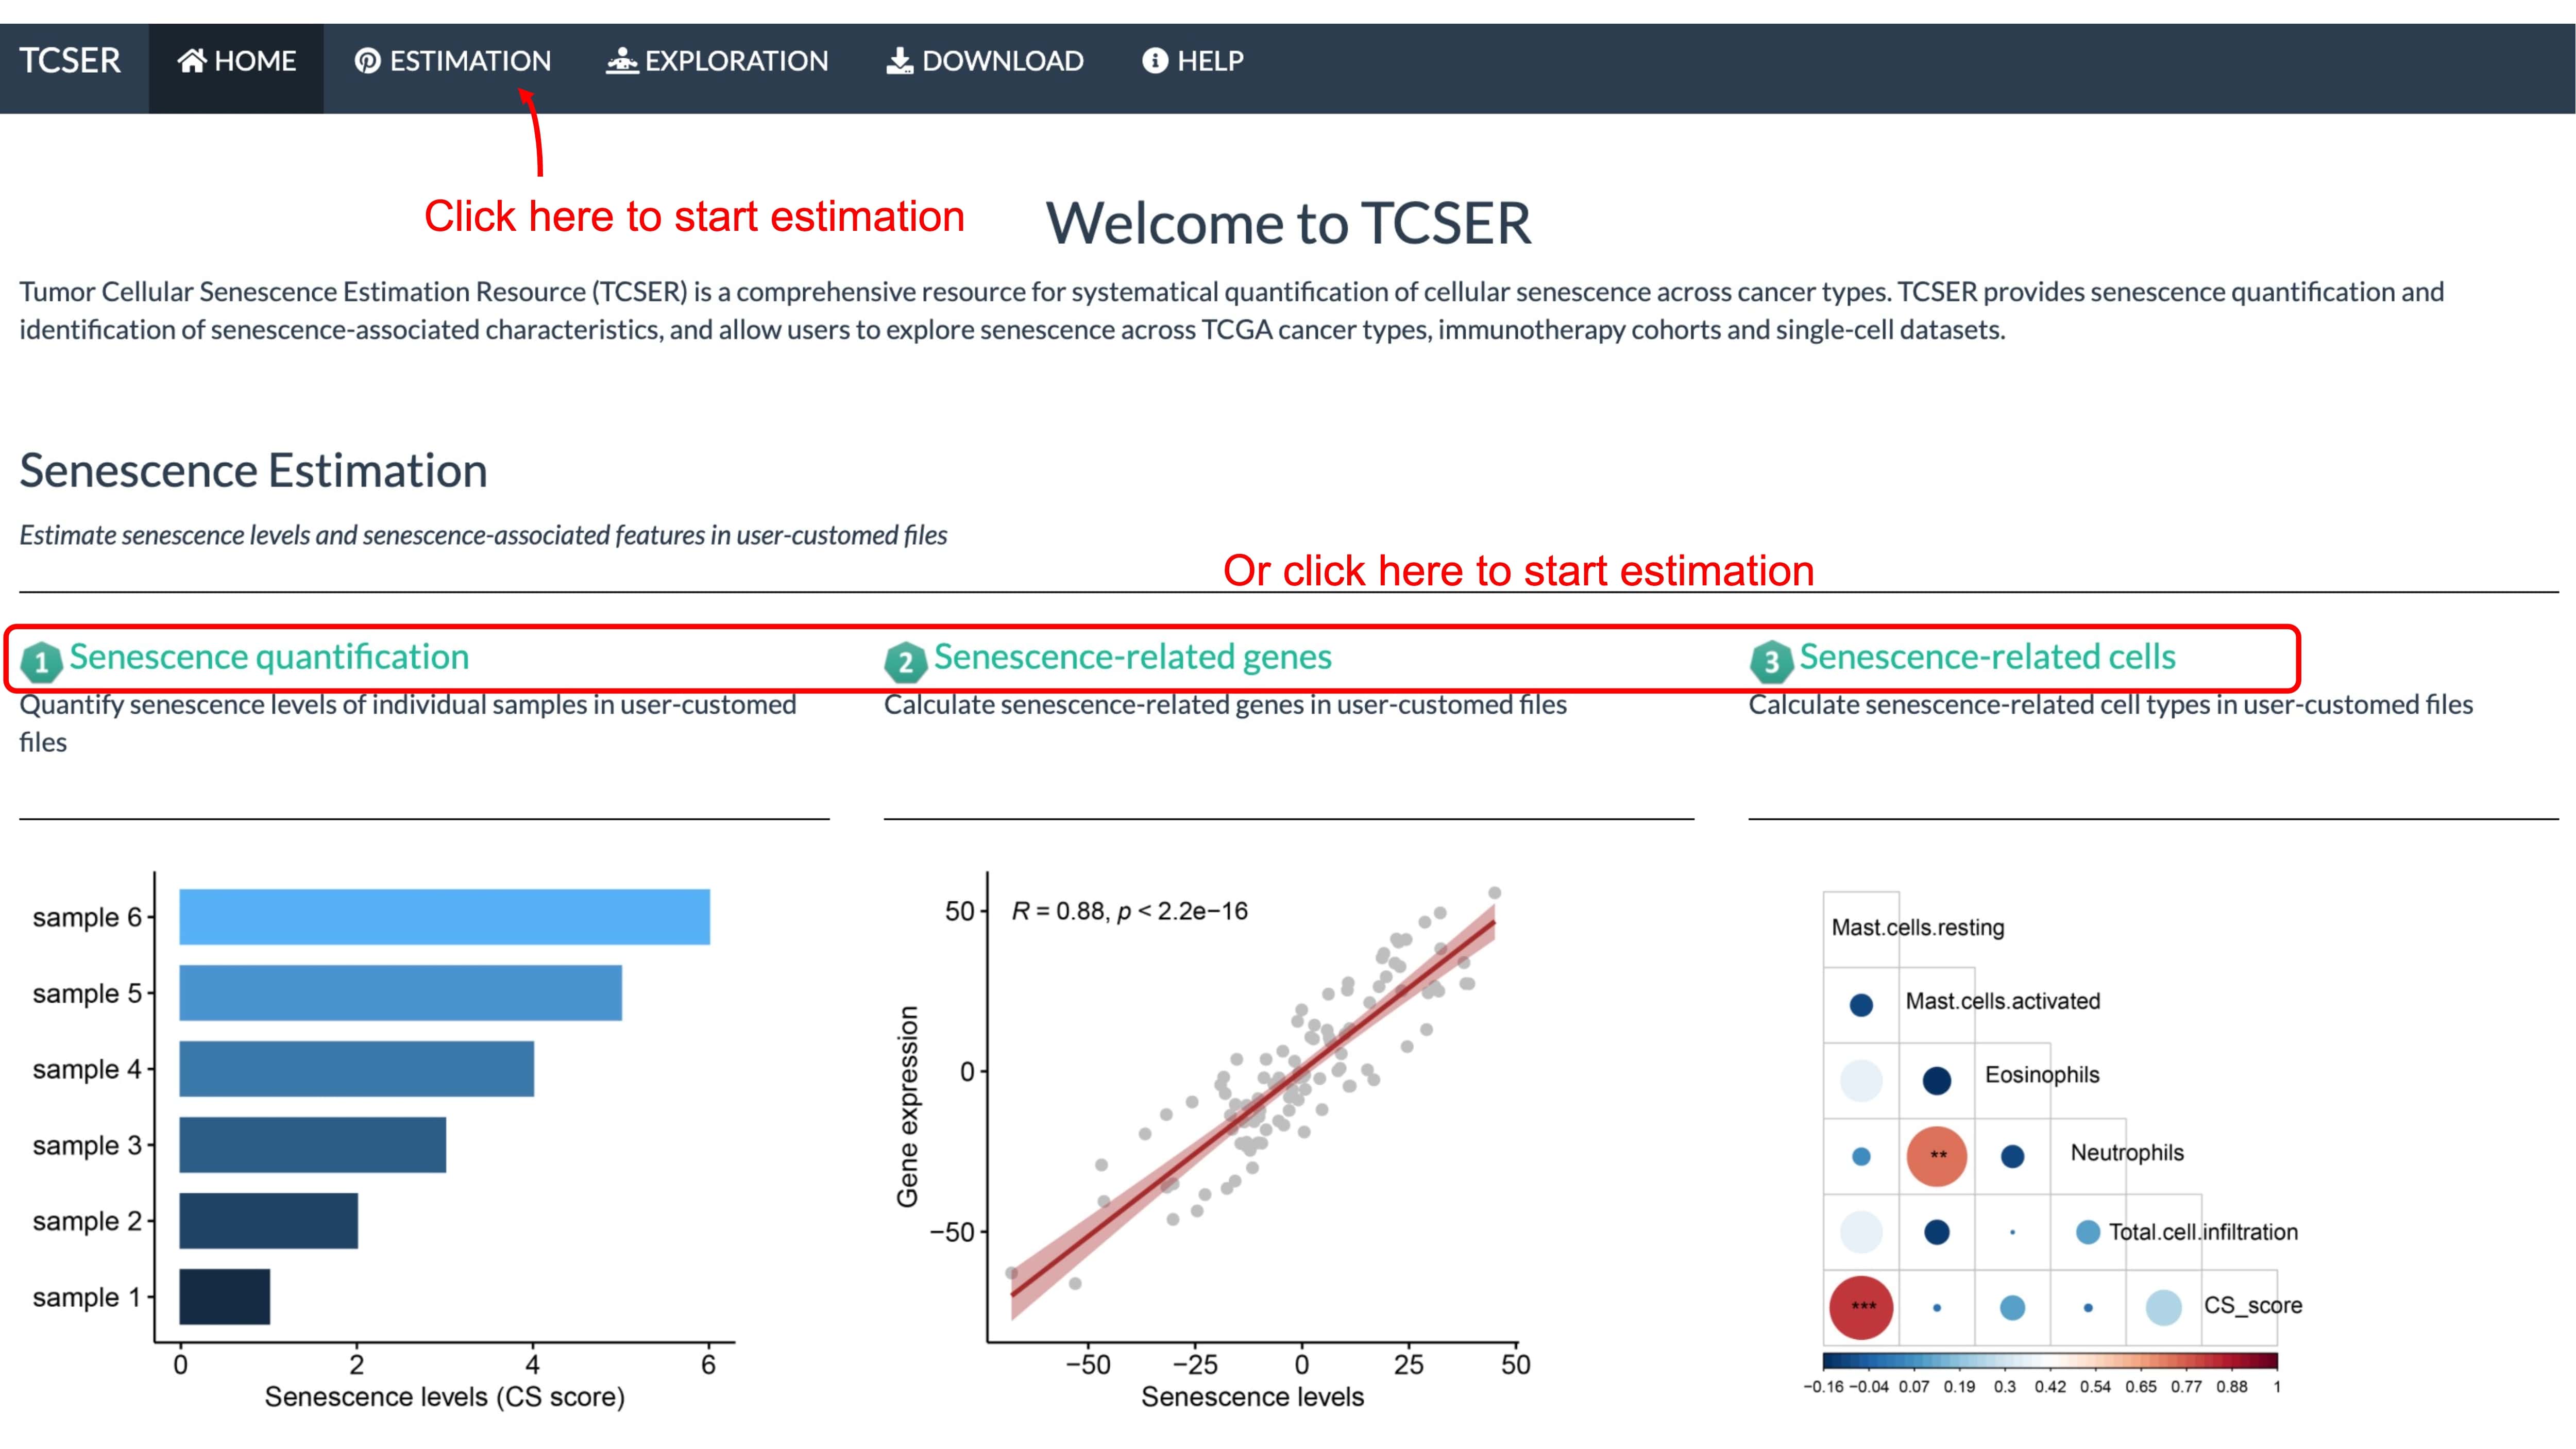
Please note the analysis of senescence quantification should be the first step and identification of senescence-associated cells may cost several minutes.
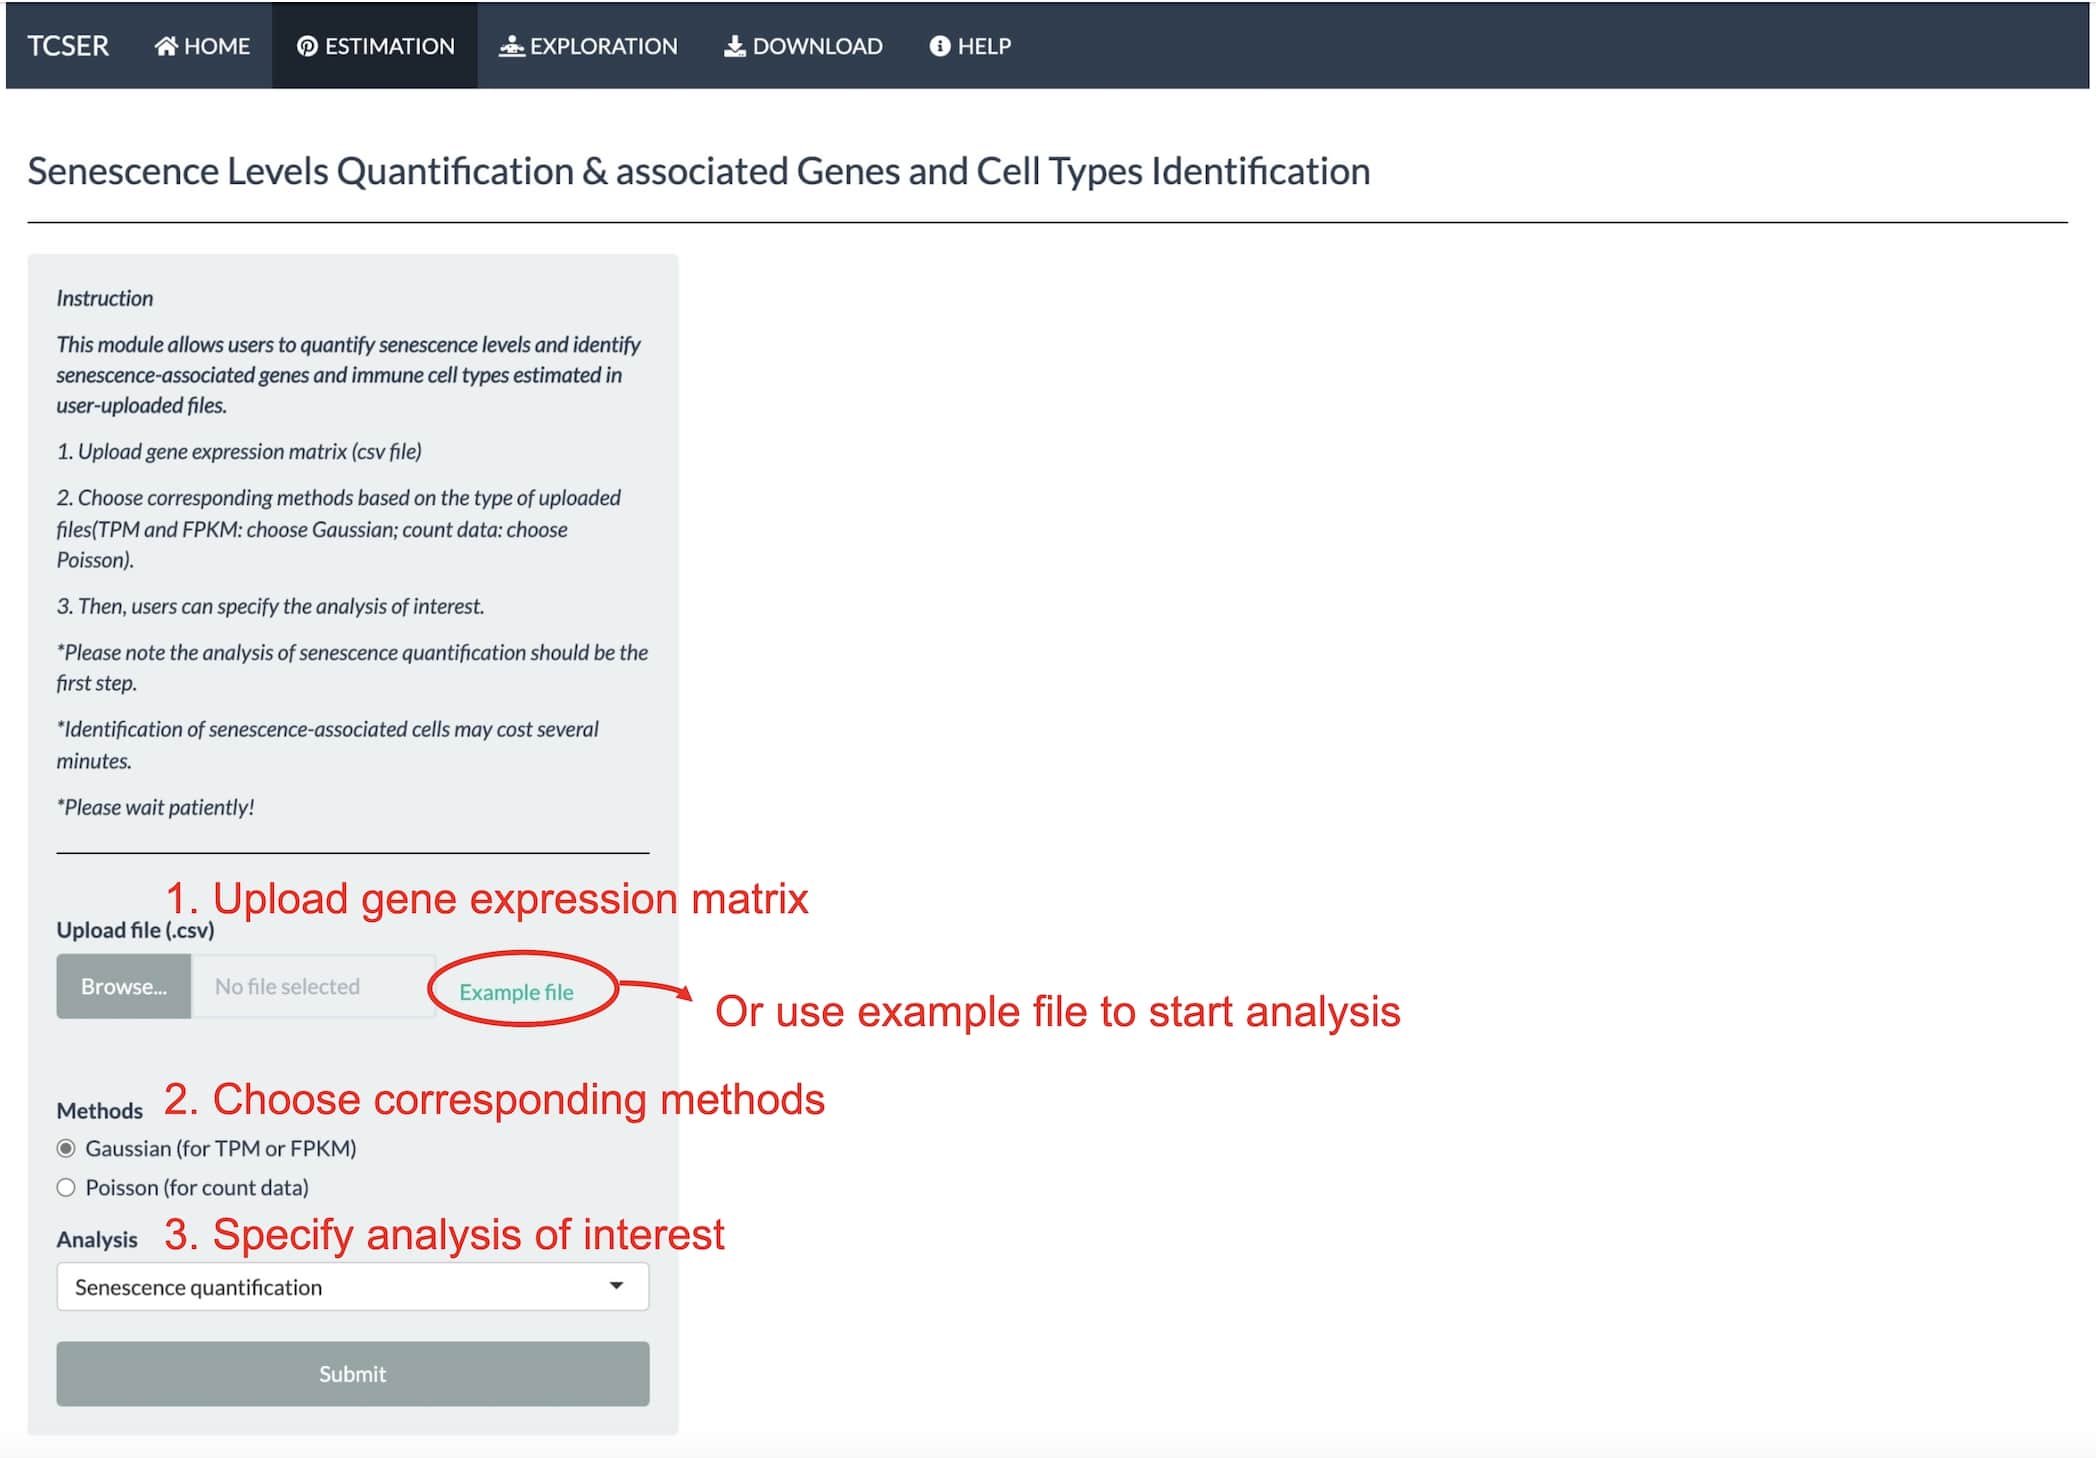
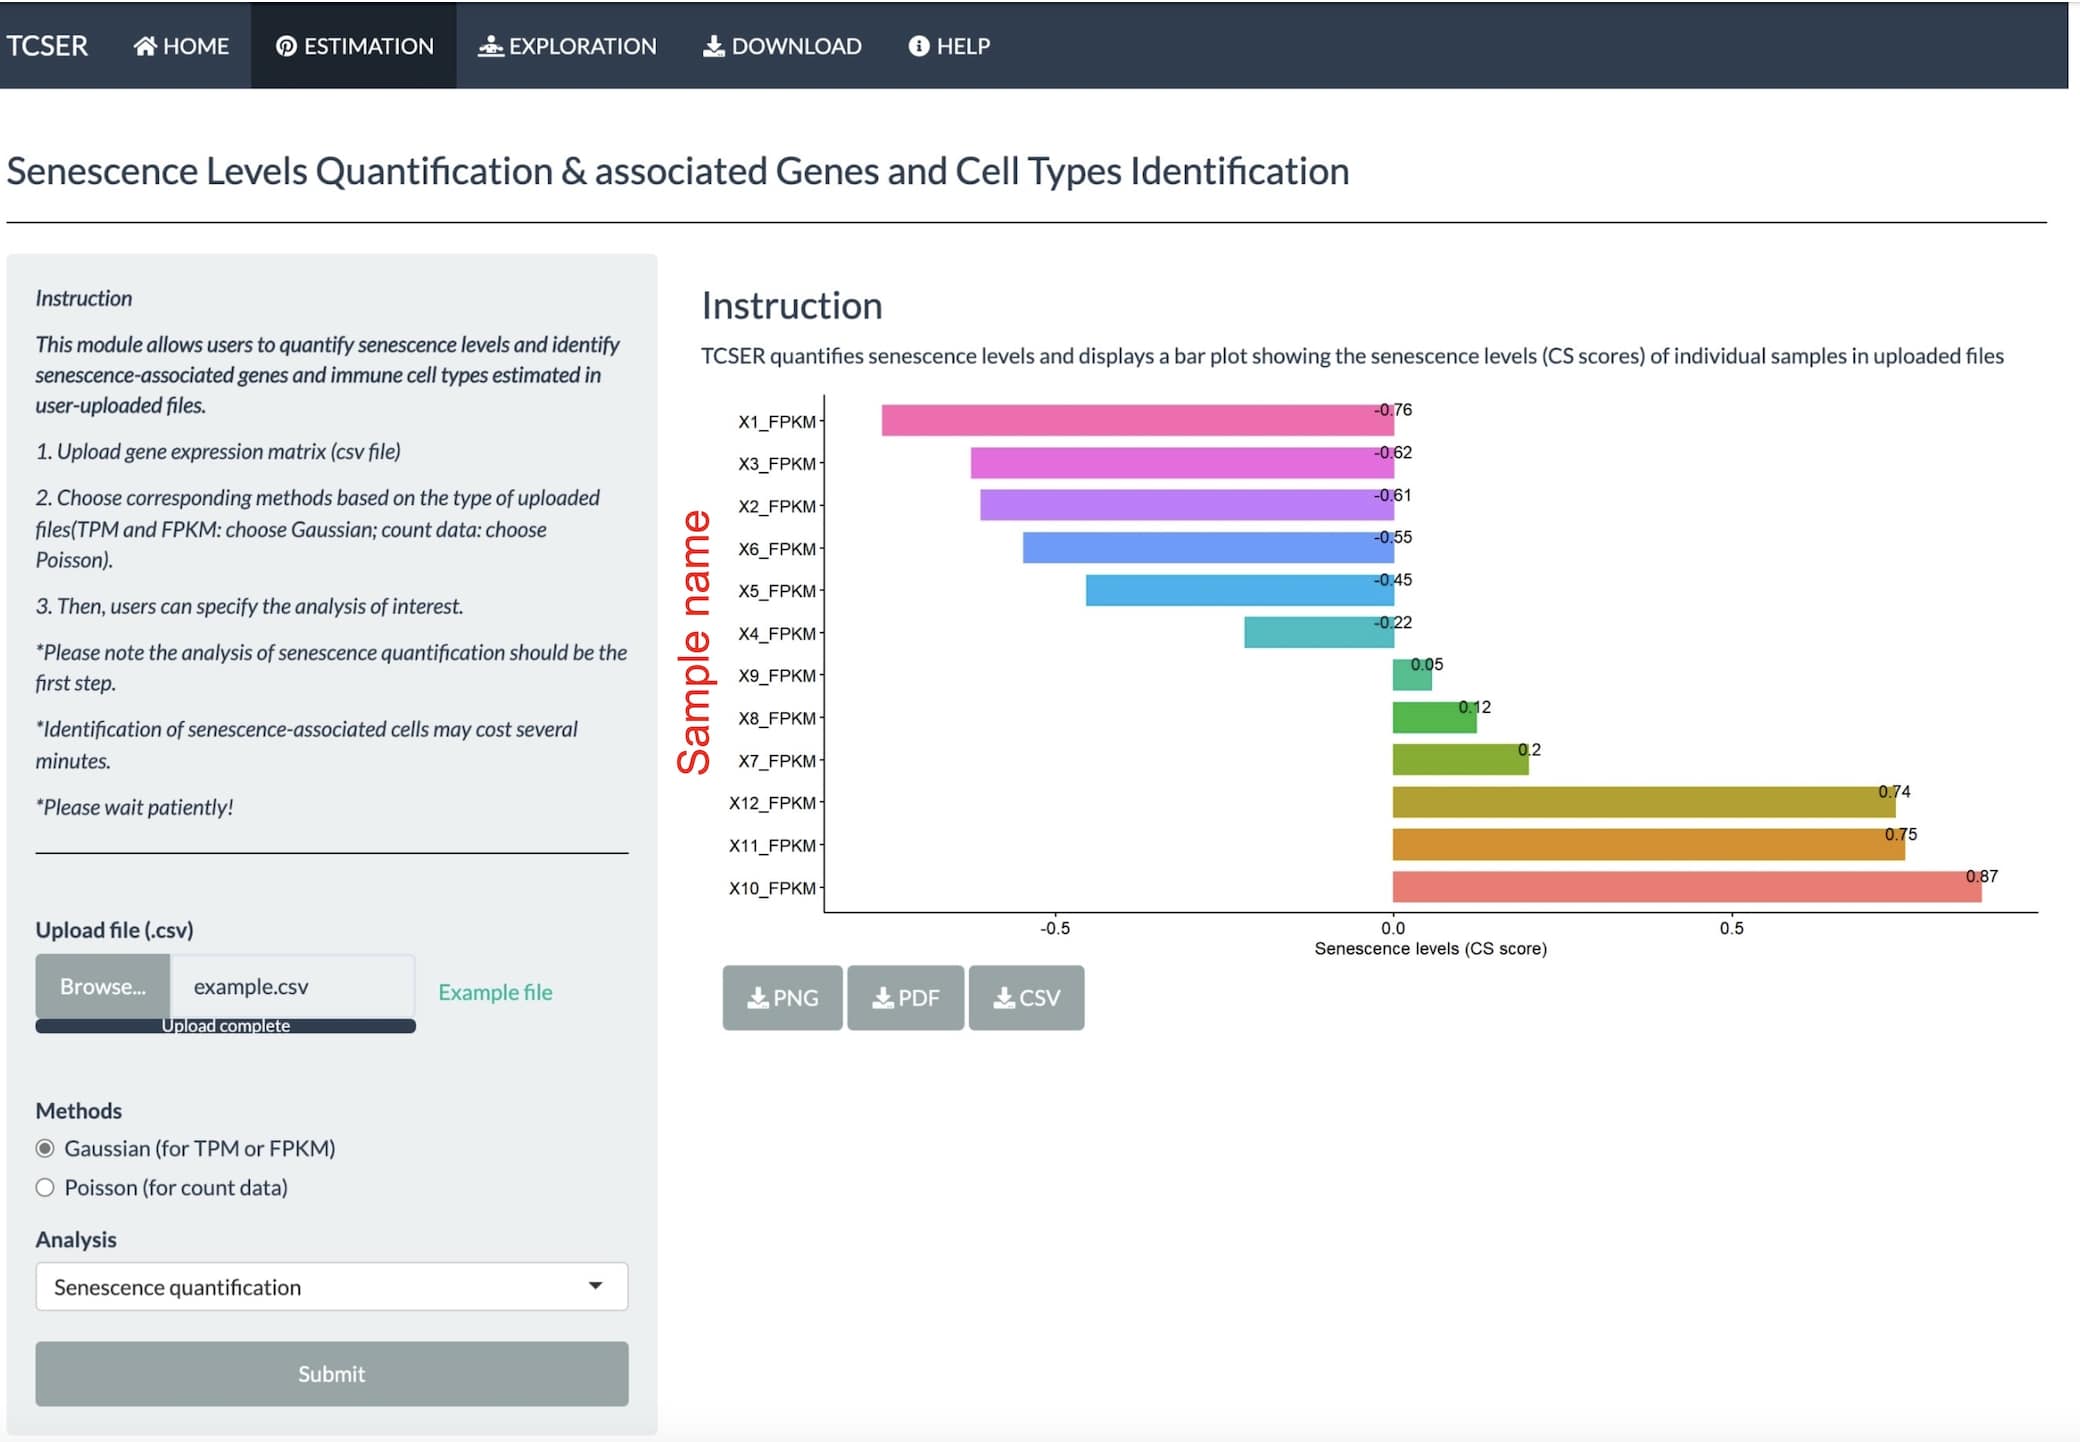
Take example file as an example, choose Gaussian method and select senescence quantification analysis then click the submit button, a bar plot will be displayed to show the CS scores of individual samples.
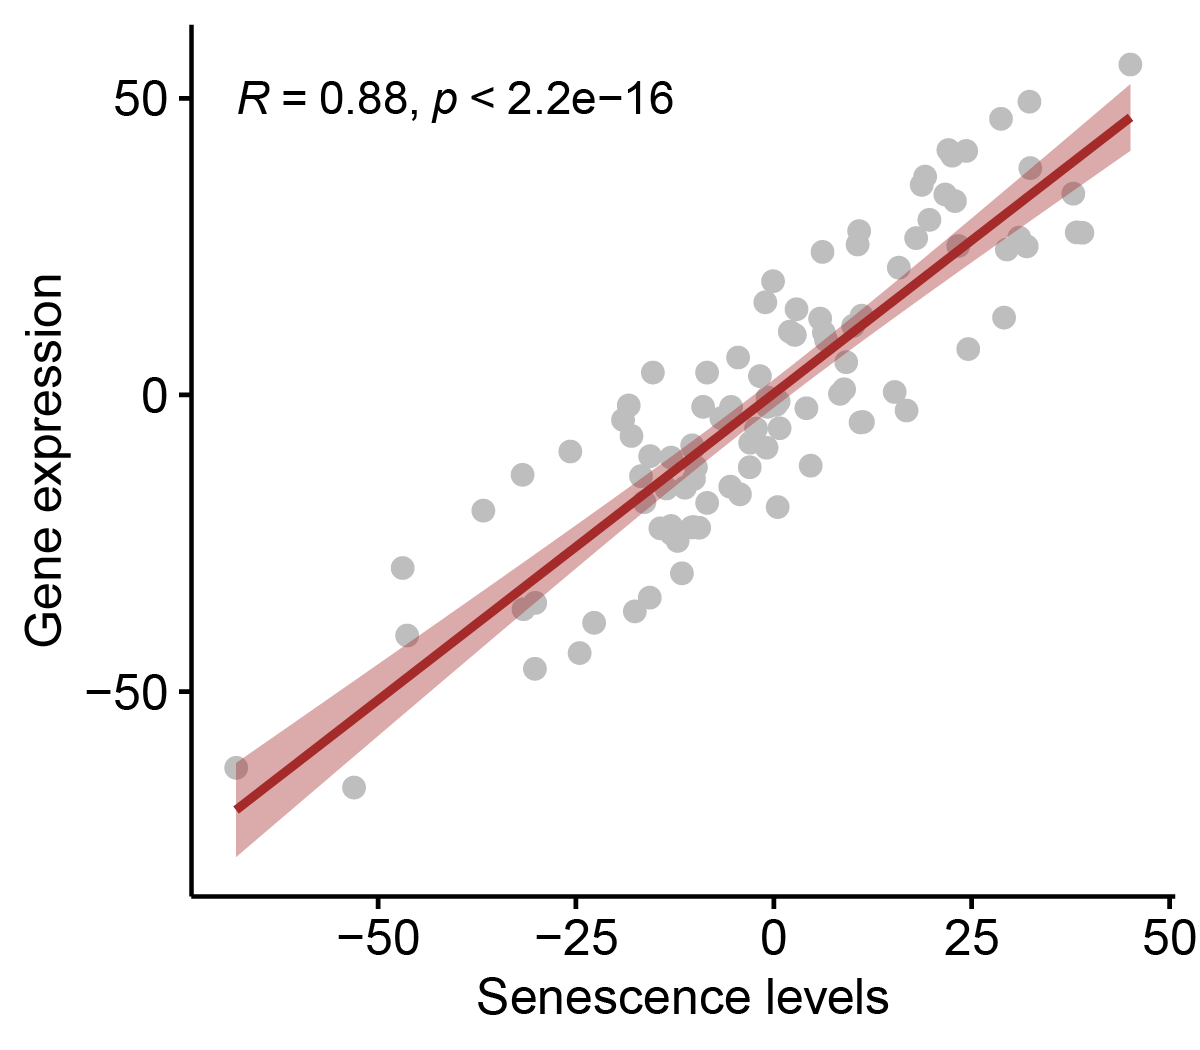
The website can identify the correlations between CS scores and gene expressions in individual samples and list CS correlated genes.
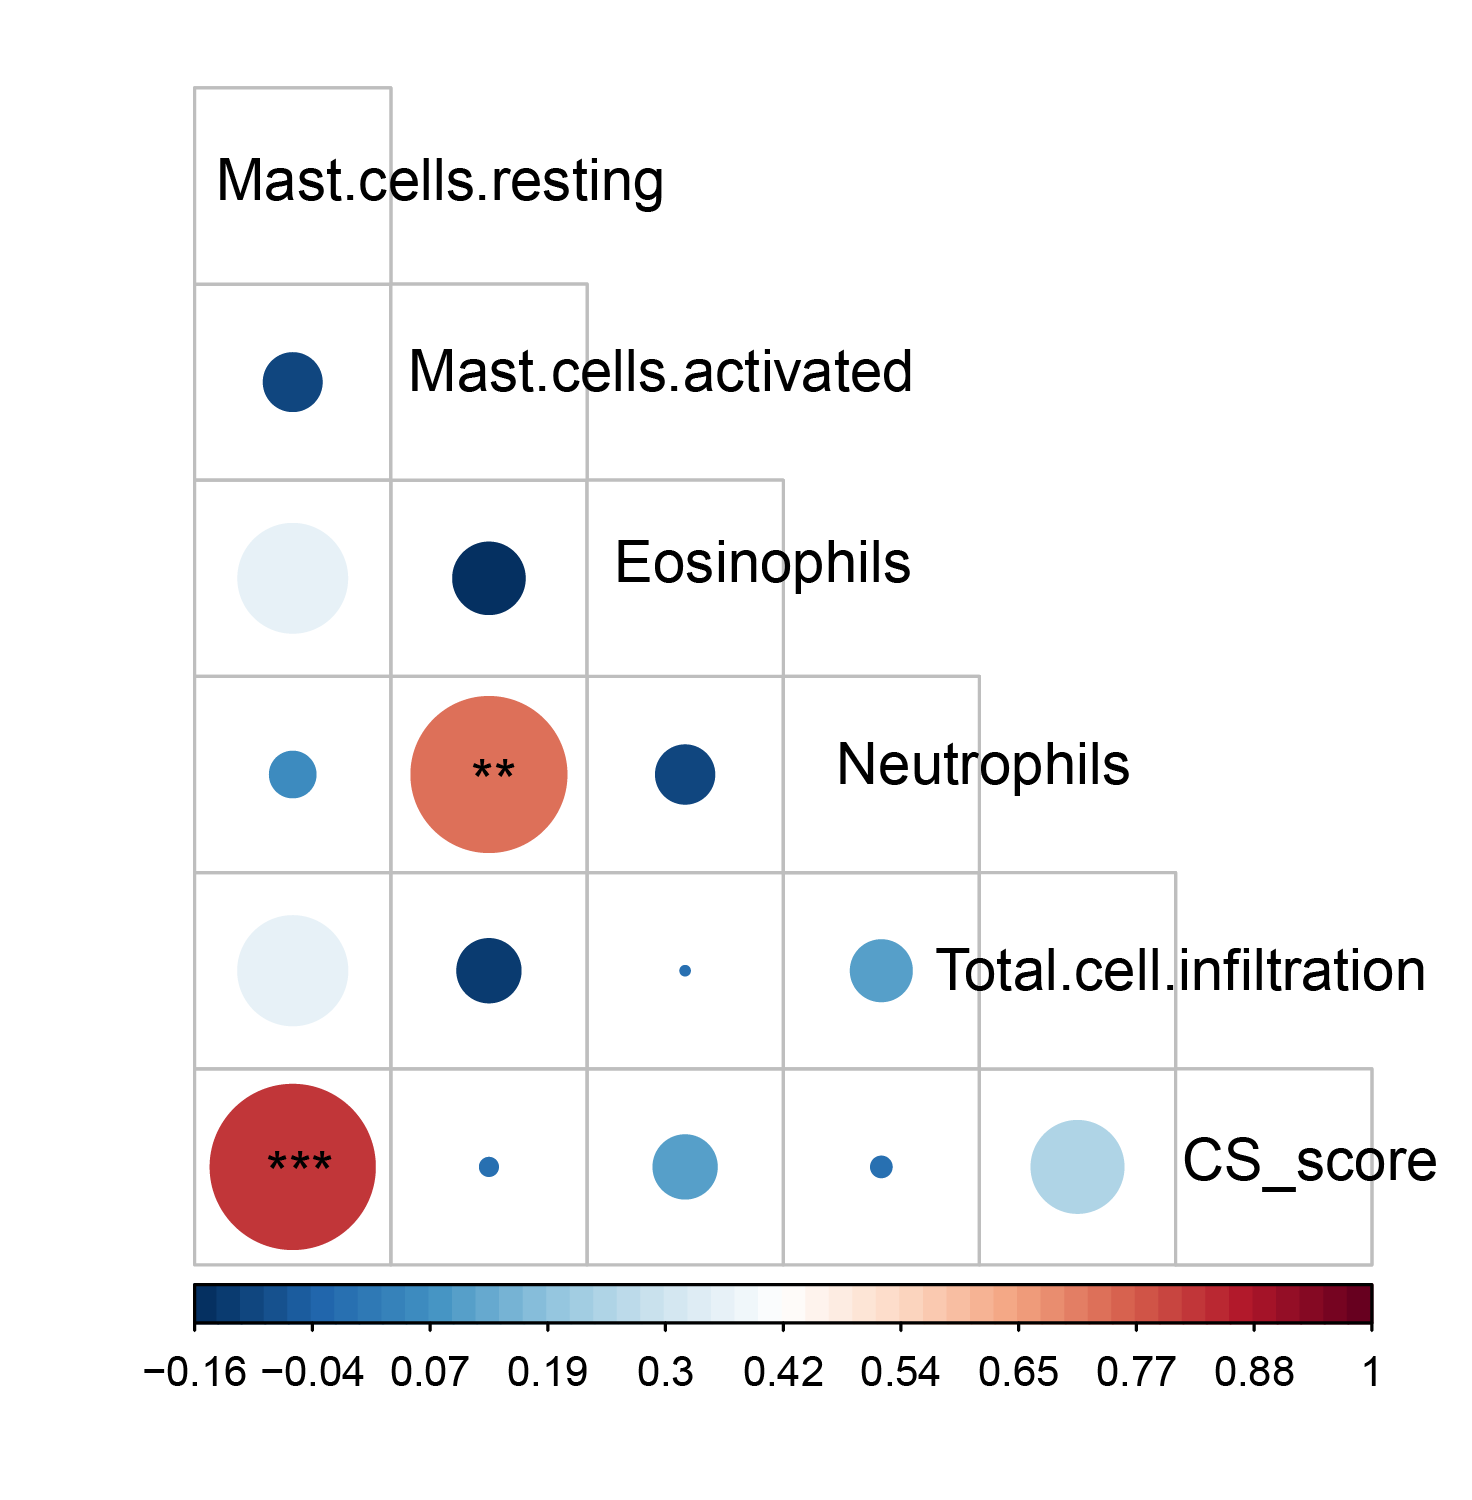
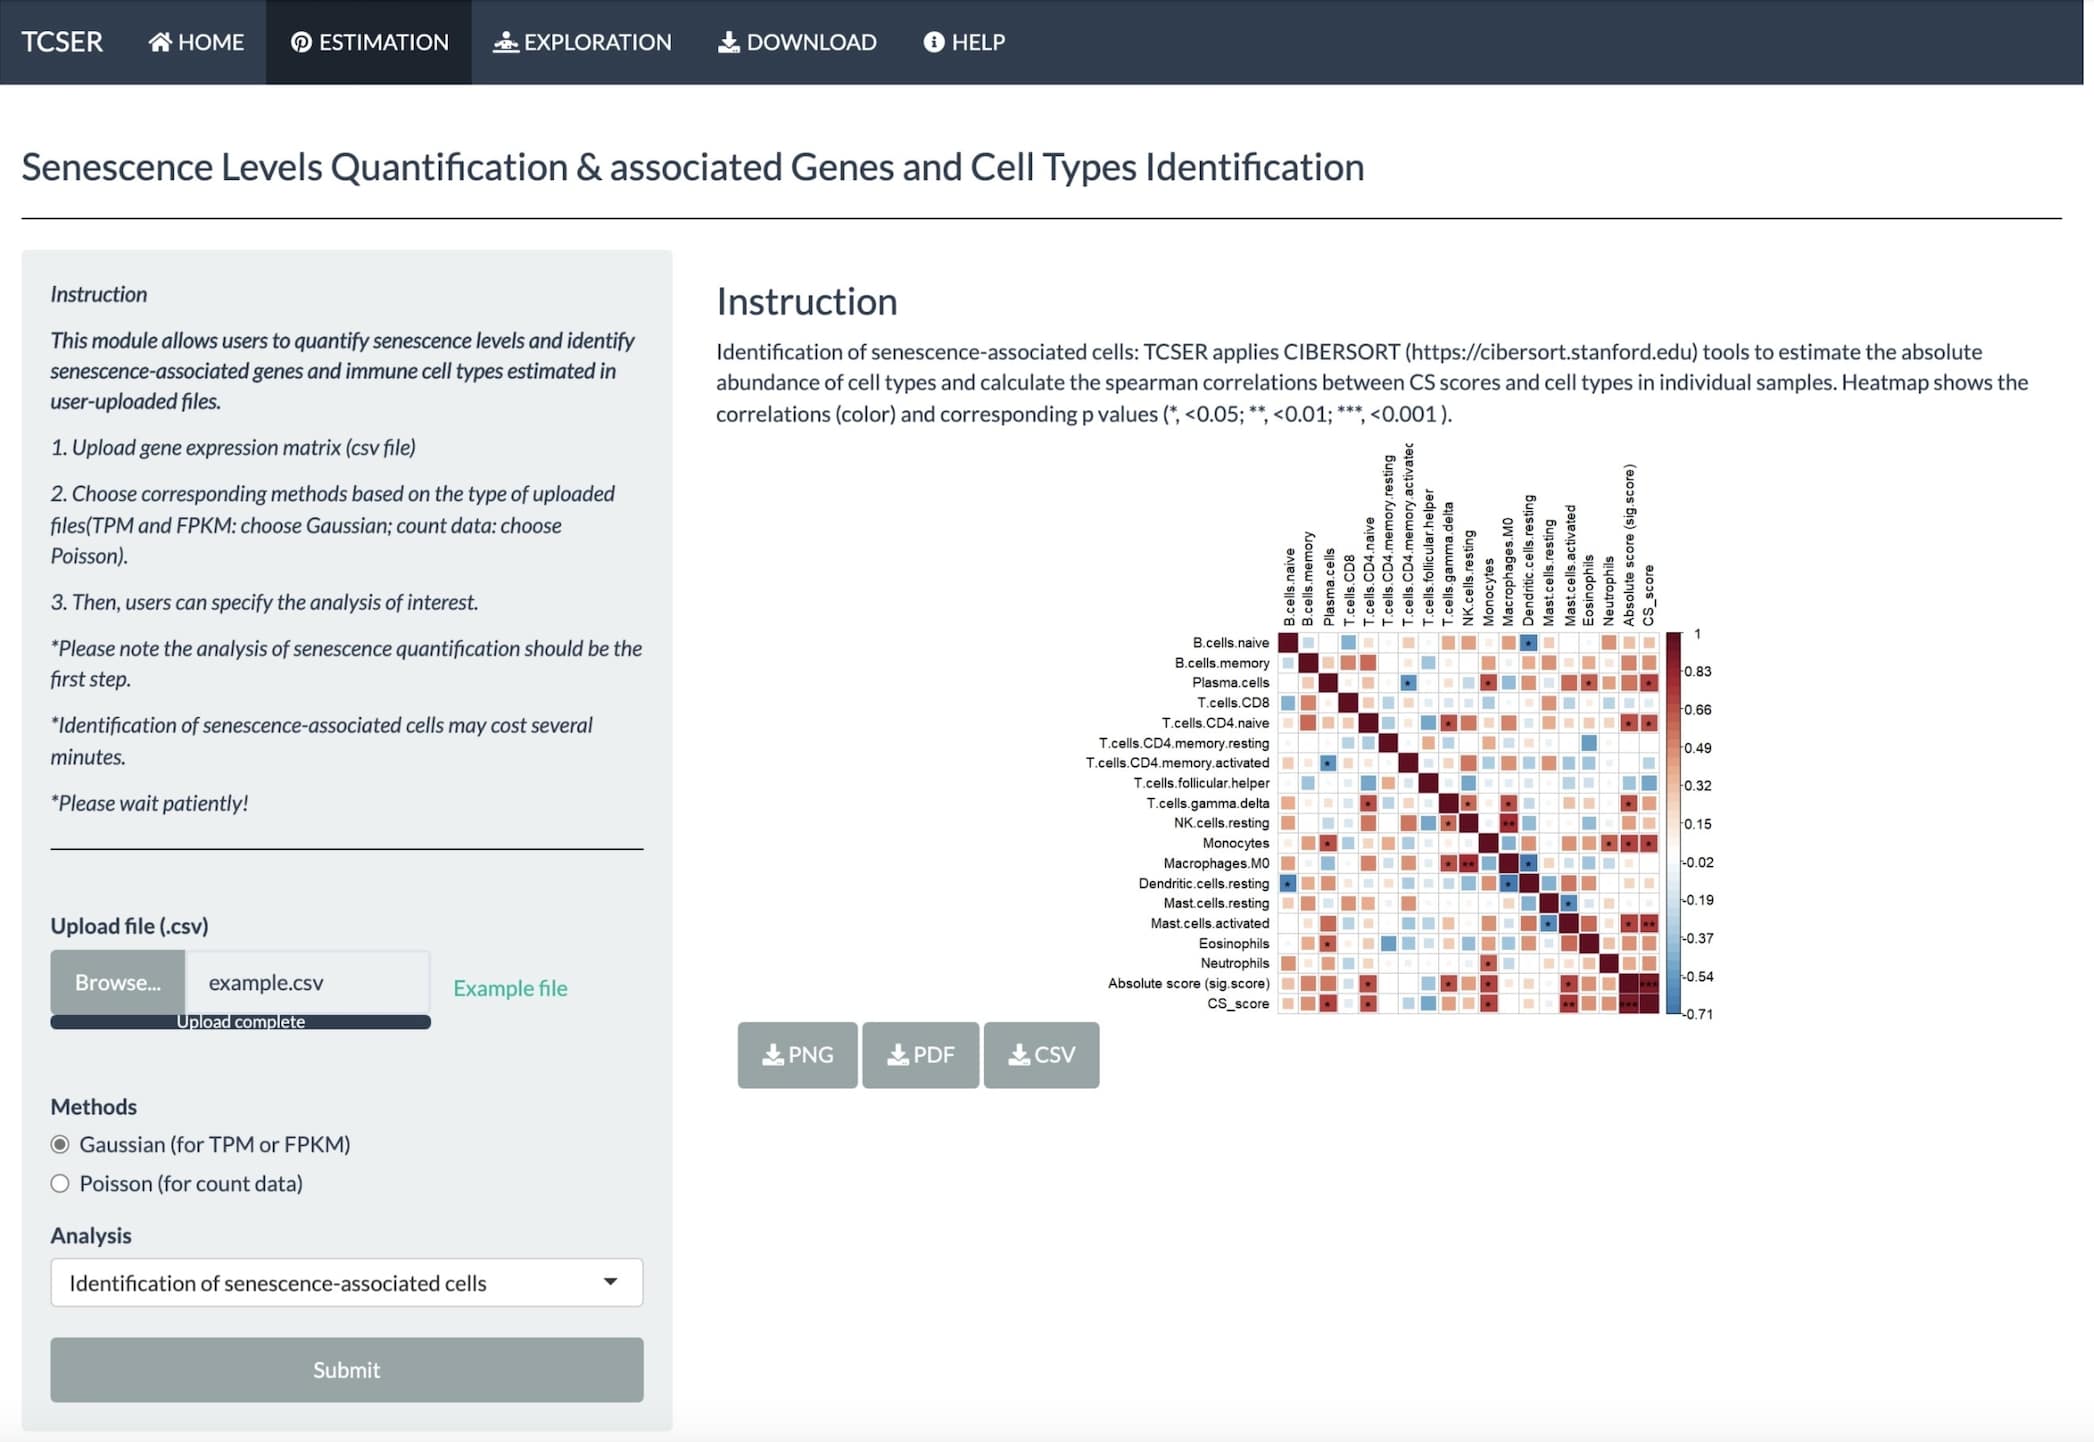
TCSER also calculates the correlations between CS scores and cell types in individual samples.
Exploration of senescence-associated features in public datasets
The senescence exploration section contains three parts: TCGA analysis, Immunotherapy Response Prediction and Single-cell analysis. TCGA analysis part includes TCGA-gene module, TCGA-mutation module and TCGA-outcome module.
*TCGA-gene module
A table will show the correlation between senescence level and gene expression. The red box means positive correlation and the blue box means negative correlation. Users are allowed to input interested gene symbols in the blank box as well.
*TCGA-mutation module
Users can specify any cancer type and two waterfall plots indicating high and low senescence samples related driver gene mutations respectively are shown below.
*TCGA-outcome module
Kaplan-Meier (KM) curves display the survivals between high and low senescence patients in selected cancer type. Users are allowed to choose OS (overall survival) or PFS (progression-free survival) and add multiple factors such as sex, diagnosis age and race into the model.
*Immunotherapy Response Prediction
AUC plot shows prediction of immunotherapy response based on CSscore in eight datasets (BLCA_EGAS#00001002556,GC_PRJEB25780,NSCLC_GSE126044,SKCM_GSE115821,Zhao2019_Glioblastoma,Miao2018_Kidney,Lauss2017_Melanoma,Raize2017_Melanoma).
*Single-cell analysis
Users are allowed to select datasets (PRAD_GSE141445, CRC_GSE146771, Glioma_GSE102130, Glioma_GSE131928_10X, Glioma_GSE131928_Smartseq2, NSCLC_GSE117570, NSCLC_GSE143423). UMAP plot shows major cell types and boxplot compares the difference of CS scores across major cell types.
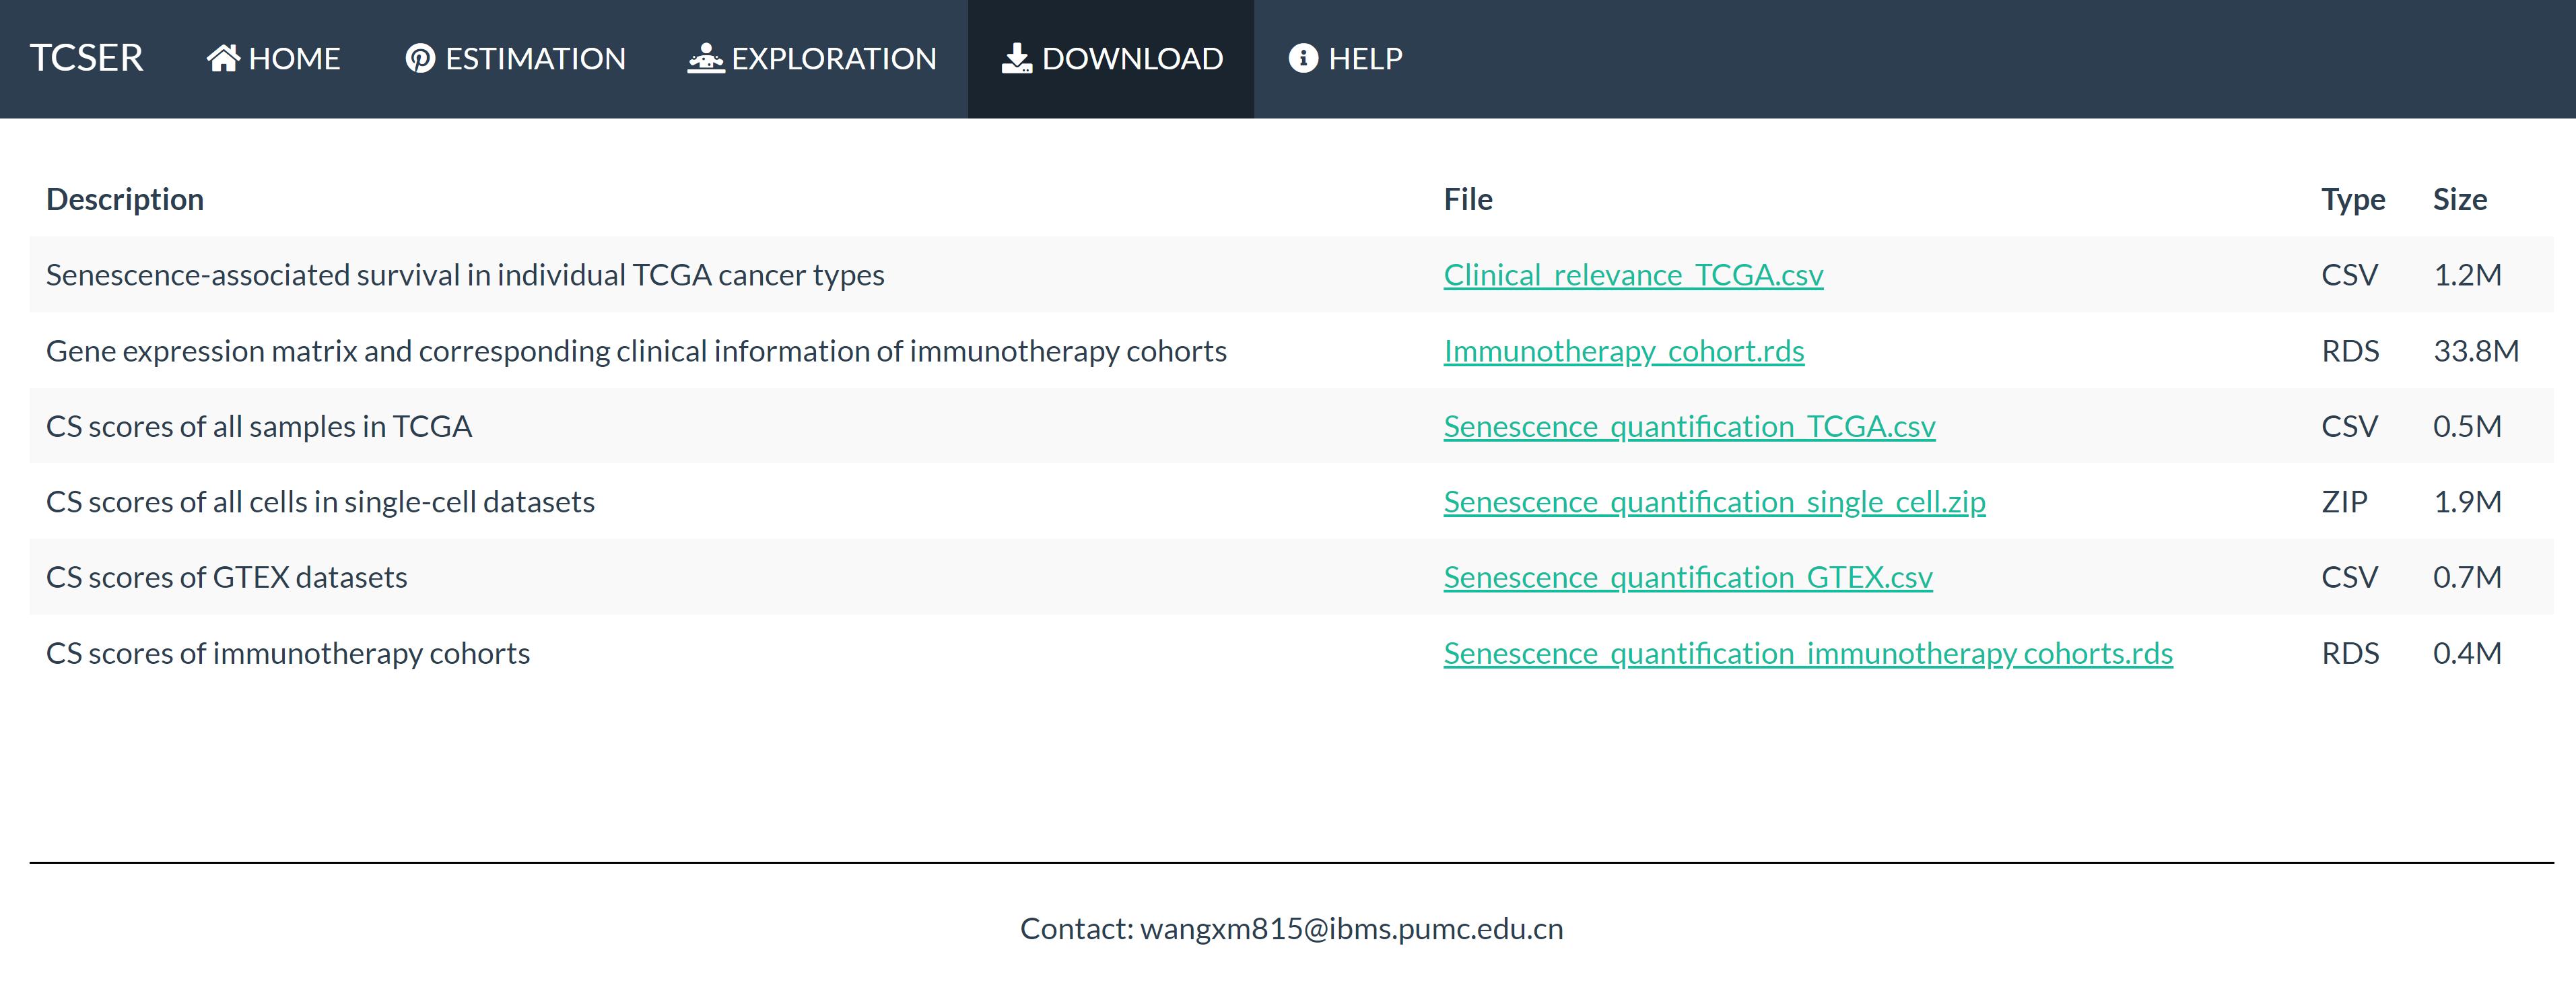
Download
Users are convenient to download four files:
Clinical relevance TCGA.csv, Immunotherapy cohort.rds, Senescence quantification TCGA.csv, Senescence quantification single cell.zip,Senescence_quantification_GTEX.csv,Senescence_quantification_immunotherapy cohorts.rds.
The description of these six files are listed in the download section.